AI will outperform humans in all tasks in just 45 years – Daily Mail

In less than 50 years, artificial intelligence will be able to beat humans at all of their own tasks, according to a new study.

And, the first hints of this shift will become apparent much sooner.

Within the next ten years alone, the researchers found AI will outperform humans in language translation, truck driving, and even writing high-school essays – and, they say machines could be writing bestselling books by 2049.

Scroll down for video 

In less than 50 years, artificial intelligence will be able to beat humans at all of their own tasks, according to a new study. And, the first hints of this shift will become apparent much sooner. A stock image is pictured 

In a new study, researchers from Oxford University’s Future of Humanity Institute, Yale University, and AI Impacts surveyed 352 machine learning experts to forecast the progress of AI in the next few decades.

The experts were asked about the timing of specific capabilities and occupations, as well as their predictions on when AI will become superior over humans in all tasks – and what the social implications of this might be.

The researchers predicted that machines will be better than humans at translating languages by 2024, writing high-school essays by 2026, driving a truck by 2027, and working in retail by 2031.

By 2049, they’ll be able to write a bestseller, and by 2053, they’ll be working as surgeons, they said.

According to the researchers, there’s a 50 percent chance artificial intelligence will outperform humans in all tasks in just 45 years.

And, by the same likelihood, they say machines could take over all human jobs in 120 years.

Some said this could even happen sooner.

JOBS THAT PAY LESS THAN $20 ARE AT RISK OF ROBOT TAKEOVER 

There is an 83 percent chance that artificial intelligence will eventually takeover positions that pay low-wages, says White House’s Council of Economic Advisors (CEA).

A recent report suggests that those who are paid less than $20 an hour will be unemployed and see their jobs filled by robots over the next few years.

But for workers who earn more than $20 an hour there is only a 31 percent chance and those paid double have just a 4 percent risk.

To reach these numbers the CEA’s 2016 economic report referred to a 2013 study about the ‘automation of jobs performed by Oxford researchers that assigned a risk of automation to 702 different occupations’.

Those jobs were then matched to a wage that determines the worker’s risk of having their jobs taken over by a robot.

‘The median probability of automation was then calculated for three ranges of hourly wage: less than 20 dollars; 20 to 40 dollars; and more than 40 dollars,’ reads the report.

The risk of having your job taken over by a robot, Council of Economic Advisers Chairman Jason Furman told reporters that it ‘varies enormously based on what your salary is.’ 

Furman also noted that the threat of robots moving in on low-wage jobs is, ‘another example of why those investments in education to make sure that people have skills that complements automation are so important,’ referring to programs advocated by President Obama. 

Artificial intelligence is fast improving its capabilities, and has increasingly proven itself in historically human-dominated fields.

The Google-owned algorithm AlphaGo, for example, just recently defeated the world’s top player in the ancient Chinese game Go, sweeping a three-game series.

After outperforming humans on numerous occasions, the algorithm – which has been anointed the new ‘Go god’ – is now retiring.

While AI is expected to benefit society in many ways, the researchers also say machines will present a new set of challenges.

‘Advances in artificial intelligence will have massive social consequences,’ the authors wrote.

Artificial intelligence is fast improving its capabilities, and has increasingly proven itself in historically human-dominated fields. The experts were asked about the timing of specific capabilities and occupations. A stock image is pictured 

‘Self-driving technology might replace millions of driving jobs over the coming decade.

‘In addition to possible unemployment, the transition will bring new challenges, such as rebuilding infrastructure, protecting vehicle cyber-security, and adapting laws and regulations.

‘New challenges, both for AI developers and policy-makers, will also arise from applications in law enforcement, military technology, and marketing.’

The news isn’t all bad, though.

In the survey, the researchers also determined the probability of an ‘extremely bad’ outcome, like human extinction as a result of AI, is only 5 percent.

from artificial intelligence – Google News http://news.google.com/news/url?sa=t&fd=R&ct2=us&usg=AFQjCNEn-QDigHNP8oQqg8NpZevTMNx8wA&clid=c3a7d30bb8a4878e06b80cf16b898331&ei=xxwwWeiDK9bNhQHskYGIDQ&url=http://www.dailymail.co.uk/sciencetech/article-4560824/AI-outperform-humans-tasks-just-45-years.html

The 8 competencies of user experience: a tool for assessing and developing UX Practitioners

A UX practitioner demonstrates 8 core competencies. By assessing each team member’s ‘signature’ in these eight areas, managers can build a fully rounded user experience team. This approach also helps identify the roles for which each team member is most suited alongside areas for individual development.

I’ve written before about the fact that a full-stack user experience professional needs to be like a modern day Leonardo da Vinci, but I’m still often asked: ‘What skills does a UX designer need?’ It’s true that the term ‘UX Designer’ is problematic but that doesn’t mean we should avoid identifying the competences in which an individual needs to be accomplished to work in the field of user experience. Managers still need to identify the gaps in their user experience team and HR departments still need to set proper criteria for hiring and writing job postings (instead of just scanning CVs for keywords that they may not understand).

Key competencies

I’ve previously argued that the key competences you need as a user experience practitioner fall into 8 areas:

  • User needs research
  • Usability evaluation
  • Information architecture
  • Interaction design
  • Visual design
  • Technical writing
  • User interface prototyping
  • User experience leadership

These are ‘competencies’ but to properly understand them we need to identify the behaviours that underlie them. What behaviours describe the knowledge, skills and actions shown by the best performers in each of these competency areas?

In the following sections, I describe the behaviours behind each of these competences along with a downloadable star chart that you can use to create a ‘signature’ for each member of your team. Then I’ll review the canonical signatures for a range of different practitioners so you can build a fully rounded user experience team.

User needs research

This competence is defined by the following behaviours:

  • Articulate the importance of user research, not just before the system is designed but also during design and after deployment.
  • Identify the potential users of the system.
  • Plan site visits to end users, including deciding who to sample.
  • Structure an effective interview that gets beyond the surface opinions (what users say) to reveal user goals (what users want).
  • Keep appropriate records of each observation.
  • Analyse qualitative data from a site visit.
  • Present the data from a site visit in ways that can be used to drive design: for example, personas, user stories, user journey maps.
  • Analyse and interpret existing data (for example web analytics, user surveys, customer support calls).
  • Critically evaluate previous user research.

Usability evaluation

This competence is defined by the following behaviours:

  • Choose the most appropriate evaluation method (e.g. formative v summative test, moderated v unmoderated test, lab v remote test, usability testing v expert review, usability testing v A/B test, usability testing v survey).
  • Interpret usability principles and guidelines and use them to identify likely problems in user interfaces.
  • Understand how to design an experiment, and how to control and measure variables.
  • Plan and administer different types of usability evaluation.
  • Log the data from usability evaluations.
  • Analyse the data from usability evaluations.
  • Measure usability.
  • Prioritise usability problems.
  • Choose the most appropriate format for sharing findings and recommendations: for example, a report, a presentation, a daily stand-up or a highlights video.
  • Persuade the design team to take action on the results.

Information architecture

This competence is defined by the following behaviours:

  • Establish the flow between a person and a product, service, or environment (‘service design’).
  • Uncover and describe users’ models of the work domain.
  • Organise, structure and label content, functions and features.
  • Choose between different design patterns for organising content (such as faceted navigation, tagging, hub and spoke etc).
  • Develop a controlled vocabulary.
  • Articulate the importance and use of metadata.
  • Analyse search logs.
  • Run online and offline card sorting sessions.

Interaction design

This competence is defined by the following behaviours:

  • Choose between different user interface patterns (for example, Wizards, Organiser Workspaces and Coach Marks).
  • Use the correct user interface ‘grammar’: e.g., choosing the correct control in an interface, such as checkbox v radio button.
  • Describe how a specific user interface interaction will behave (for example, pinch to zoom).
  • Create user interface animations.
  • Create affordances within a user interface.
  • Create design ideas toward a solution.
  • Sketch and tell user-centred stories about the way an interaction should work.

Visual design

This competence is defined by the following behaviours:

  • Use fundamental principles of visual design (like contrast, alignment, repetition and proximity) to de-clutter user interfaces.
  • Choose appropriate typography.
  • Devise grids.
  • Lay out pages.
  • Choose colour palettes.
  • Develop icons.
  • Articulate the importance of following a common brand style.

Technical writing

This competence is defined by the following behaviours:

  • Write content in plain English.
  • Phrase content from the user’s perspective (rather than the system’s perspective).
  • Create content that helps users complete tasks and transactions.
  • Express complex ideas concisely.
  • Create and edit macro- and micro-copy.
  • Write content in the tone of voice that matches the organisation’s identity or brand.
  • Choose the right kind of help for the situation: tutorials v manuals v contextual help v micro-copy.

User interface prototyping

This competence is defined by the following behaviours:

  • Translate ideas into interactions by developing prototypes and simulations.
  • Choose the appropriate fidelity of prototype for the phase of design.
  • Articulate the benefits of fast iteration.
  • Create paper prototypes.
  • Properly explore the design space before deciding on a solution.
  • Create interactive electronic prototypes.

User experience leadership

This competence is defined by the following behaviours:

  • Plan and schedule user experience work.
  • Constructively critique the work of team members.
  • Argue the cost-benefit of user experience activities.
  • Lead a multidisciplinary team.
  • Assemble team members for a project.
  • Promote ongoing professional development of the team.
  • Liaise with stakeholders.
  • Manage client expectations.
  • Measure and monitor the effect of UX on the company’s success.
  • Evangelise UX throughout the company.

How to assess the competence of your team

When I’m coaching people in these competences, I’ve found it useful to formalise the discussion around a simple star chart. The purpose of the star chart is simply to provide a framework for our conversation, although people tell me they find it a useful reference that they can return to and assess their progress over time.

You’ll notice that the star chart contains the 8 competences that I’ve reviewed in this article along with a 5-point scale for each one. This 5-point scale is to frame a discussion only; it’s there to help people identify their strengths and weaknesses.

Unless you have worked with each of your team members for several years, I recommend that you ask team members to assess their own competency. I usually give people the following instructions:

Pick one of the competency areas on this star chart that you are most familiar with. Read over the behavioural descriptions for this competency area and then rate your own competency between 0 and 5, using the following scale:

0 I don’t understand this competence or it is non-existent
1 Novice: I have a basic understanding of this competence
2 Advanced beginner: I can demonstrate this competence under supervision
3 Competent: I can demonstrate this competence independently
4 Proficient: I can supervise other people in this competence
5 Expert: I develop new ways of applying this competence

Then move onto the other competency areas and complete the diagram.

There are problems when you ask people to rate their own competence. The Dunning-Kruger effect tells us that novices tend to overestimate their competency and experts tend to underestimate their competency. For example, a novice who should rate themselves a ‘1’ may over-rate themselves as a 2 or 3 whereas an expert that should rate themselves a ‘5’ may under-rate themselves as a 3 or 4. To counteract this bias, I recommend that you either (a) ignore the absolute ratings and instead look at a team member’s general pattern across the 8 competencies; or (b) you follow up each chart with an interview where you ask team members to provide specific examples of behaviours to justify their rating. I have some other suggestions on how you can use the star charts in the ‘Next Steps’ section at the end of this article.

Mapping the competences to UX design roles

The field of user experience has a bewildering array of job titles (I wrote about this in the past in The UX Job Title Generator). So to map these competencies onto different user experience roles, I’ve taken some of the practitioner roles from Merholz and Skinner’s (2016) recent book, ‘Org Design for Design Orgs’. I’ve chosen this book because it’s both up-to-date and written by acknowledged experts in the field.

If you skip ahead to the star charts, you’ll notice that I would expect every practitioner in every role to have at least a basic understanding of each competence area: this is the level of knowledge someone would have that has acquired the BCS Foundation Certificate in User Experience. Beyond that, there are different patterns for each role.

The following charts show the mapping for both junior and senior practitioners. The solid line shows the minimum levels of competence for a junior practitioner and the arrows show the areas where a senior practitioner should extend into (the ‘4’ and ‘5’ areas). Because of their breadth of experience, I would expect senior practitioners to show an expansion into 2s and 3s in other competencies too. However, to keep the diagrams simple, I’ve not shown this.

The question of what an optimal star chart looks like is ultimately going to vary with each person, their personal goals, and the needs of the organisation. But the following role-based descriptions may help you with this discussion. And just as importantly, this approach should prevent your team from trying to recruit clones of themselves. It should help everyone realise the range of competencies needed by a fully rounded user experience team.

UX Researcher

Merholz and Skinner describe the UX Researcher as responsible for generative and evaluative research. Generative research means field research to generate “insights for framing problems in new ways” and evaluative research means testing the “efficacy of designed solutions, through observing use and seeing where people have problems”. The competence signature I would expect to see of someone in this role would show expertise in user needs research and usability evaluation.

The solid line shows the minimum competence levels for a junior UX Researcher. The arrows show the levels that senior practitioners should attain (usually 4s and 5s). Because of their breadth of experience, senior practitioners should also display a broader signature (2s and 3s) in other areas of the star chart (this will be individual-specific and not role-specific).

Product Designer

Merholz and Skinner describe the Product Designer as “responsible for the interaction design, the visual design and sometimes even front-end development”. The competence signature I would expect to see of someone in this role would show expertise in visual design and interaction design and to a lesser extent, prototyping.

The solid line shows the minimum competence levels for a junior Product Designer. The arrows show the levels that senior practitioners should attain (usually 4s and 5s). Because of their breadth of experience, senior practitioners should also display a broader signature (2s and 3s) in other areas of the star chart (this will be individual-specific and not role-specific).

Creative Technologist

Merholz and Skinner describe the Creative Technologist as someone who helps the design team explore design solutions through interactive prototyping. This role is distinct from front-end development: “The Creative Technologist is less concerned about delivery than possibility”. The competence signature I would expect to see of someone in this role would show expertise in prototyping and to a lesser extent, visual design and interaction design.

The solid line shows the minimum competence levels for a junior Creative Technologist. The arrows show the levels that senior practitioners should attain (usually 4s and 5s). Because of their breadth of experience, senior practitioners should also display a broader signature (2s and 3s) in other areas of the star chart (this will be individual-specific and not role-specific).

Content Strategist

Merholz and Skinner describe the Content Strategist as someone who “develops content models and navigation design” and who “write[s] the words, whether it’s the labels in the user interface, or the copy that helps people accomplish their tasks”. The competence signature I would expect to see of someone in this role would show expertise in technical writing and information architecture.

The solid line shows the minimum competence levels for a junior Content Strategist. The arrows show the levels that senior practitioners should attain (usually 4s and 5s). Because of their breadth of experience, senior practitioners should also display a broader signature (2s and 3s) in other areas of the star chart (this will be individual-specific and not role-specific).

Communication Designer

Merholz and Skinner describe the Communication Designer as someone with a background in the visual arts and graphic design and is aware of “core concepts such as layout, color, composition, typography, and use of imagery”. The competence signature I would expect to see of someone in this role would show expertise in visual design.

The solid line shows the minimum competence levels for a junior Communication Designer. The arrows show the levels that senior practitioners should attain (usually 4s and 5s). Because of their breadth of experience, senior practitioners should also display a broader signature (2s and 3s) in other areas of the star chart (this will be individual-specific and not role-specific).

Next steps

If you manage a user experience team:

  • Download the PDF template and ask each member of your team complete the star chart as a self-reflection exercise. Discuss the results as a group and use the discussion to identify the competency areas where your team thinks it needs support.
  • Given the environment where your team works, what would an ‘ideal’ team composition look like?
  • Discuss the results individually with each team member in a 1–1 to objectively identify areas where your rating of their competence differs from their rating. What behaviours do you expect them to demonstrate to prove they actually are a 3, 4 or 5?
  • The diagram could also serve as a way to set performance goals for evaluation and professional development purposes.

If you are a practitioner who works in the field, I encourage you to download the PDF template and sketch out your own competence signature.

  • Use the diagram as a benchmark (current state) to identify areas for improvement.
  • Compare your signature with the ones in this article to discover if you are in the role you want and if not, see what competencies you need to develop to move into a different role.
  • Use the 8 competency areas as a structure for your portfolio.

If you do not work in the field but are responsible for recruiting people to user experience teams:

  • Use the competency descriptions in this article to set behavioural-based criteria for hiring and writing job postings.

Acknowledgements

Thanks to Philip Hodgson and Todd Zazelenchuk for comments on an earlier draft of this article.

Originally published at userfocus.co.uk.

from Stories by David Travis on Medium https://medium.com/@userfocus/the-8-competencies-of-user-experience-a-tool-for-assessing-and-developing-ux-practitioners-631770c6d2da?source=rss-934fcb05e8b5——2

The best Data Science courses on the internet, ranked by your reviews


The best Data Science courses on the internet, ranked by your reviews

A year and a half ago, I dropped out of one of the best computer science programs in Canada. I started creating my own data science master’s program using online resources. I realized that I could learn everything I needed through edX, Coursera, and Udacity instead. And I could learn it faster, more efficiently, and for a fraction of the cost.

I’m almost finished now. I’ve taken many data science-related courses and audited portions of many more. I know the options out there, and what skills are needed for learners preparing for a data analyst or data scientist role. So I started creating a review-driven guide that recommends the best courses for each subject within data science.

For the first guide in the series, I recommended a few coding classes for the beginner data scientist. Then it was statistics and probability classes. Then introductions to data science. Then data visualization. Machine learning was the fifth and latest guide. And now I’m back to conclude this series with even more resources.

Here’s a summary of all my previous guides, plus recommendations for 13 other data science topics.

For each of the five major guides in this series, I spent several hours trying to identify every online course for the subject in question, extracting key bits of information from their syllabi and reviews, and compiling their ratings. My goal was to identify the three best courses available for each subject and present them to you.

The 13 supplemental topics — like databases, big data, and general software engineering — didn’t have enough courses to justify full guides. But over the past eight months, I kept track of them as I came across them. I also scoured the internet for courses I may have missed.

For these tasks, I turned to none other than the open source Class Central community, and its database of thousands of course ratings and reviews.

Class Central’s homepage.

Since 2011, Class Central founder Dhawal Shah has kept a closer eye on online courses than arguably anyone else in the world. Dhawal personally helped me assemble this list of resources.

How we picked courses to consider

Each course within each guide must fit certain criteria. There were subject-specific criteria, then two common ones that each guide shared:

  1. It must be on-demand or offered every few months.
  2. It must be an interactive online course, so no books or read-only tutorials. Though these are viable ways to learn, this guide focuses on courses. Courses that are strictly videos (i.e. with no quizzes, assignments, etc.) are also excluded.

We believe we covered every notable course that fit the criteria in each guide. There is always a chance that we missed something, though. Please let us know in each guide’s comments section if we left a good course out.

How we evaluated courses

We compiled average ratings and number of reviews from Class Central and other review sites to calculate a weighted average rating for each course. We read text reviews and used this feedback to supplement the numerical ratings.

We made subjective syllabus judgment calls based on a variety of factors specific to each subject. The criteria in our intro to programming guide, for example:

  1. Coverage of the fundamentals of programming.
  2. Coverage of more advanced, but useful, topics in programming.
  3. How much of the syllabus is relevant to data science?

Here are the best courses overall for each of these topics. Together these form a comprehensive data science curriculum.

Subject #1: Intro to Programming

Learn to Program: The Fundamentals (LPT1) and Crafting Quality Code (LPT2) by the University of Toronto via Coursera

The University of Toronto’s Learn to Program series has an excellent mix of content difficulty and scope for the beginner data scientist. Taught in Python, the series has a 4.71-star weighted average rating over 284 reviews.

The University of Toronto offers Learn to Program: The Fundamentals (LPT1) and Crafting Quality Code (LPT2), taught by Jennifer Campbell and Paul Gries, via Coursera.

An Introduction to Interactive Programming in Python (Part 1) and (Part 2) by Rice University via Coursera

Rice University’s Interactive Programming in Python series contains two of the best online courses ever. They skew towards games and interactive applications, which are less applicable topics in data science. The series has a 4.93-star weighted average rating over 6,069 reviews.

R Programming Track by DataCamp

If you are set on learning R, DataCamp’s R Programming Track effectively combines programming fundamentals and R syntax instruction. It has a 4.29-star weighted average rating over 14 reviews.

Subject #2: Statistics & Probability

Foundations of Data Analysis — Part 1: Statistics Using R and Part 2: Inferential Statistics by the University of Texas at Austin via edX

The courses in the UT Austin’s Foundations of Data Analysis series are two of the few with great reviews that also teach statistics and probability with a focus on coding up examples. The series has a 4.61-star weighted average rating over 28 reviews.

The promo video for UT Austin’s Foundations of Data Analysis, taught by Michael J. Mahometa.

Statistics with R Specialization by Duke University via Coursera

Duke’s Statistics with R Specialization, which is split into five courses, has a comprehensive syllabus with full sections dedicated to probability. It has a 3.6-star weighted average rating over 5 reviews, but the course it was based upon has a 4.77-star weighted average rating over 60 reviews.

Introduction to Probability — The Science of Uncertainty by the Massachusetts Institute of Technology (MIT) via edX

MIT’s Intro to Probability course by far has the highest ratings of the courses considered in the statistics and probability guide. It exclusively probability in great detail, plus it is longer (15 weeks) and more challenging than most MOOCs. It has a 4.82-star weighted average rating over 38 reviews.

Subject #3: Intro to Data Science

Data Science A-Z™: Real-Life Data Science Exercises Included by Kirill Eremenko and the SuperDataScience Team via Udemy

Kirill Eremenko’s Data Science A-Z excels in breadth and depth of coverage of the data science process. The instructor’s natural teaching ability is frequently praised by reviewers. It has a 4.5-star weighted average rating over 5,078 reviews.

The promo video for Data Science A-Z™, taught by Kirill Eremenko.

Intro to Data Analysis by Udacity

Udacity’s Intro to Data Analysis covers the data science process cohesively using Python. It has a 5-star weighted average rating over 2 reviews.

Data Science Fundamentals by Big Data University

Big Data University’s Data Science Fundamentals covers the full data science process and introduces Python, R, and several other open-source tools. There are no reviews for this course on the review sites used for this analysis.

Subject #4: Data Visualization

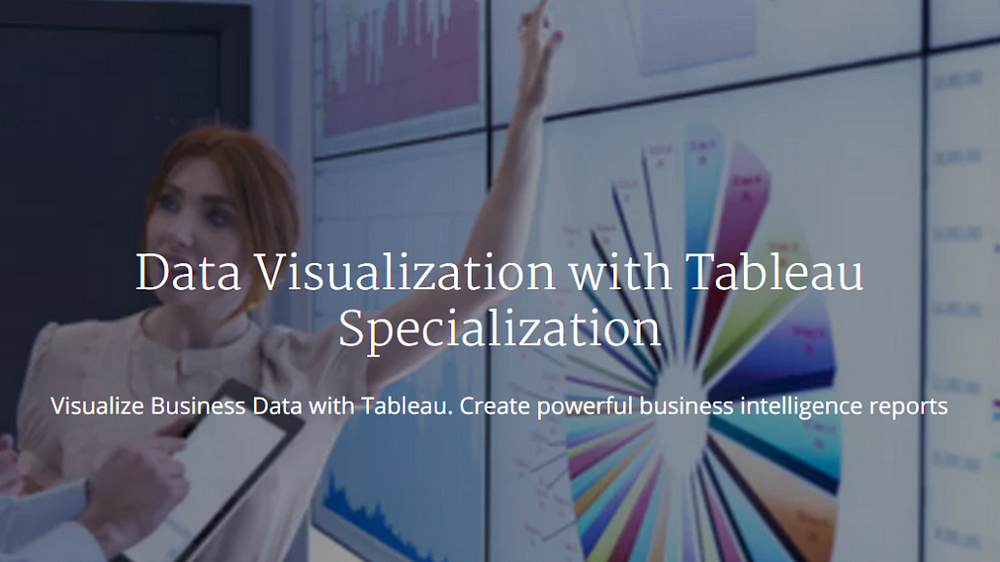
Data Visualization with Tableau Specialization by the University of California, Davis via Coursera

A five-course series, UC Davis’ Data Visualization with Tableau Specialization dives deep into visualization theory. Opportunities to practice Tableau are provided through walkthroughs and a final project. It has a 4-star weighted average rating over 2 reviews.

Data Visualization with ggplot2 Series by DataCamp

Endorsed by ggplot2 creator Hadley Wickham, a substantial amount of theory is covered in DataCamp’s Data Visualization with ggplot2 series. You will know R and its quirky syntax quite well leaving these courses. There are no reviews for these courses on the review sites used for this analysis.

Tableau 10 Series (Tableau 10 A-Z and Tableau 10 Advanced Training) by Kirill Eremenko and the SuperDataScience Team on Udemy

An effective practical introduction, Kirill Eremenko’s Tableau 10 series focuses mostly on tool coverage (Tableau) rather than data visualization theory. Together, the two courses have a 4.6-star weighted average rating over 3,724 reviews.

Subject #5: Machine Learning

Machine Learning by Stanford University via Coursera

Taught by the famous Andrew Ng, Google Brain founder and former chief scientist at Baidu, Stanford University’s Machine Learning covers all aspects of the machine learning workflow and several algorithms. Taught in MATLAB or Octave, It has a 4.7-star weighted average rating over 422 reviews.

The promo video for Stanford University’s Machine Learning, taught by Andrew Ng.

Machine Learning by Columbia University via edX

A more advanced introduction than Stanford’s, CoIumbia University’s Machine Learning is a newer course with exceptional reviews and a revered instructor. The course’s assignments can be completed using Python, MATLAB, or Octave. It has a 4.8-star weighted average rating over 10 reviews.

Machine Learning A-Z™: Hands-On Python & R In Data Science by Kirill Eremenko and Hadelin de Ponteves via Udemy

Kirill Eremenko and Hadelin de Ponteves’ Machine Learning A-Z is an impressively detailed offering that provides instruction in both Python and R, which is rare and can’t be said for any of the other top courses. It has a 4.5-star weighted average rating over 8,119 reviews.

Subject #6: Deep Learning

Creative Applications of Deep Learning with TensorFlow by Kadenze

Parag Mital’s Creative Applications of Deep Learning with Tensorflow adds a unique twist to a technical subject. The “creative applications” are inspiring, the course is professionally produced, and the instructor knows his stuff. Taught in Python, It has a 4.75-star weighted average rating over 16 reviews.

The promo video for Kadenze’s Creative Applications of Deep Learning with TensorFlow, taught by Parag Mital.

Neural Networks for Machine Learning by the University of Toronto via Coursera

Learn from a legend. Geoffrey Hinton is known as the “godfather of deep learning” is internationally distinguished for his work on artificial neural nets. His Neural Networks for Machine Learning is an advanced class. Taught in Python, it has a 4.11-star weighted average rating over 35 reviews.

Deep Learning A-Z™: Hands-On Artificial Neural Networks by Kirill Eremenko and Hadelin de Ponteves via Udemy

Deep Learning A-Z is an accessible introduction to deep learning, with intuitive explanations from Kirill Eremenko and helpful code demos from Hadelin de Ponteves. Taught in Python, it has a 4.6-star weighted average rating over 1,314 reviews.

And here’s our top course pick for each of the supplementary subjects within data science.

Python & its tools

Python Programming Track by DataCamp, plus their individual pandas courses:

DataCamp’s code-heavy instruction style and in-browser programming environment are great for learning syntax. Their Python courses have a 4.64-star weighted average rating over 14 reviews. Udacity’s Intro to Data Analysis, one of our recommendations for intro to data science courses, covers NumPy and pandas as well.

R & its tools

R Programming Track by DataCamp, plus their individual dplyr and data.table courses:

Again, DataCamp’s code-heavy instruction style and in-browser programming environment are great for learning syntax. Their R Programming Track, which is also one of our recommendations for programming courses in general, effectively combines programming fundamentals and R syntax instruction. The series has a 4.29-star weighted average rating over 14 reviews.

Databases & SQL

Introduction to Databases by Stanford University via Stanford OpenEdx (note: reviews from the deprecated version on Coursera)

Stanford University’s Introduction to Databases covers database theory comprehensively while introducing several open source tools. Programming exercises are challenging. Jennifer Widom, now the Dean of Stanford’s School of Engineering, is clear and precise. It has a 4.61-star weighted average rating over 59 reviews.

The promo video for Stanford University’s Introduction to Databases, taught by Jennifer Widom.

Data Preparation

Importing & Cleaning Data Tracks by DataCamp:

DataCamp’s Importing & Cleaning Data Tracks (one in Python and one in R) excel at teaching the mechanics of preparing your data for analysis and/or visualization. There are no reviews for these courses on the review sites used for this analysis.

Exploratory Data Analysis

Data Analysis with R by Udacity and Facebook

Udacity’s Data Analysis with R is an enjoyable introduction to exploratory data analysis. The expert interviews with Facebook’s data scientists are insightful and inspiring. The course has a 4.58-star weighted average rating over 19 reviews. It also serves as a light introduction to R.

An interview with Aude Hofleitner, Facebook Data Scientist, in Udacity’s Data Analysis with R.

Big Data

The Ultimate Hands-On Hadoop — Tame your Big Data! by Frank Kane via Udemy, then if you want more on specific tools (all by Frank Kane via Udemy):

Frank Kane’s Big Data series teaches all of the most popular big data technologies, including over 25 in the “Ultimate” course alone. Kane shares his knowledge from a decade of industry experience working with distributed systems at Amazon and IMDb. Together, the courses have a 4.52-star weighted average rating over 6,932 reviews.

The promo video for Frank Kane’s The Ultimate Hands-On Hadoop — Tame your Big Data!

Software Skills

Software Testing by Udacity

Software Debugging by Udacity

Version Control with Git and GitHub & Collaboration by Udacity (updates to Udacity’s popular How to Use Git & GitHub course)

Software skills are an oft-overlooked part of a data science education. Udacity’s testing, debugging, and version control courses introduce three core topics relevant to anyone who deals with code, especially those in team-based environments. Together, the courses have a 4.34-star weighted average rating over 68 reviews. Georgia Tech and Udacity have a new course that covers software testing and debugging together, though it is more advanced and not all relevant for data scientists.

The intro video for Udacity’s GitHub & Collaboration, taught by Richard Kalehoff.

Miscellaneous

Building a Data Science Team by Johns Hopkins University via Coursera

Learning How to Learn: Powerful mental tools to help you master tough subjects by Dr. Barbara Oakley and the University of California, San Diego via Coursera

Mindshift: Break Through Obstacles to Learning and Discover Your Hidden Potential by Dr. Barbara Oakley and McMaster University via Coursera

Johns Hopkins University’s Building a Data Science Team provides a useful peek into data science in practice. It is an extremely short course that can be completed in a handful of hours and audited for free. Ignore its 3.41-star weighted average rating over 12 reviews, some of which were likely from paying customers.

Dr. Barbara Oakley’s Learning How to Learn and Mindshift aren’t data science courses per se. Learning How to Learn, the most popular online course ever, covers best practices shown by research to be most effective for mastering tough subjects, including memory techniques and dealing with procrastination. In Mindshift, she demonstrates how to get the most out of online learning and MOOCs, how to seek out and work with mentors, and the secrets to avoiding career ruts and general ruts in life. These are two courses that everyone should take. They have a 4.74-star and a 4.87-star weighted average rating over 959 and 407 reviews, respectively.

The promo video for Learning How to Learn, taught by Dr. Barbara Oakley.

This Future of This Guide

This Data Science Career Guide will continue to be updated as new courses are released and ratings and reviews for them are generated.

Are you passionate about another discipline (e.g. Computer Science)? Would you like to help educate the world? If you are interested in creating a Career Guide similar in structure to this one, drop us a note at guides@class-central.com.

My Future

As for my future, I’m excited to share that I have taken a position with Udacity as a Content Developer. That means I’ll be creating and teaching courses. That also means that this guide will be updated by somebody else.

I’m joining Udacity because I believe they are creating the best educational product in the world. Of all of the courses I have taken, online or at university, I learned best while enrolled a Nanodegree. They are incorporating the latest in pedagogy and production, and still boast the best-in-class project review system, upbeat instructors, and healthy student and career support teams. Though a piecewise approach like the one we took in this guide can work, I believe there is a ton of value in a cohesive, high-quality program.

What is a Nanodegree?

Updating the Data Analyst Nanodegree is my first task, which is a part of a larger effort to create a clear path of Nanodegrees for all things data. Students will soon be able to start from scratch with data basics at Udacity and progress all the way through machine learning, artificial intelligence, and even self-driving cars if they wish.

Wrapping it Up

This is the final piece of a six-piece series that covers the best online courses for launching yourself into the data science field. We covered programming in the first article, statistics and probability in the second article, intros to data science in the third article, data visualization in the fourth, and machine learning in the fifth.

Here, we summarized the above five articles, and recommended the best online courses for other key topics such as databases, big data, and even software engineering.

If you’re looking for a complete list of Data Science online courses, you can find them on Class Central’s Data Science and Big Data subject page.

If you enjoyed reading this, check out some of Class Central’s other pieces:

If you found this helpful, click the 💚 so more people will see it here on Medium.

This is a condensed version of my original article published on Class Central.

from freeCodeCamp https://medium.freecodecamp.com/the-best-data-science-courses-on-the-internet-ranked-by-your-reviews-6dc5b910ea40?source=rss—-336d898217ee—4

My kind of contract

The work for hire terms at Segura, a design firm in Chicago. My three favorite bits: 1. “Time is money. More time is more money.” 2. “If you want something that’s been done before, use that.” 3. The pro bono amendments.

You give me money, I’ll give you creative.
I’ll start when the check clears.
Time is money. More time is more money.
I’ll listen to you. You listen to me.
You tell me what you want, I’ll tell you what you need.
You want me to be on time, I want you to be on time.
What you use is yours, what you don’t is mine.
I can’t give you stuff I don’t own.
I’ll try not to be an ass, you should do the same.
If you want something that’s been done before, use that.

PRO BONO

If you want your way, you have to pay.
If you don’t pay, I have final say.

Let’s create something great together.

For those who will be quick to point out legal holes or missing protections, there are many ways to do business. One way is working with clients you trust — people who appreciate this approach to work. And if you guessed wrong, and someone fucks you, rather than pursuing legal remedies which cost even more time, money, and hassle, there’s an alternative: Take your losses, wash your hands, and don’t work with them again.


My kind of contract was originally published in Signal v. Noise on Medium, where people are continuing the conversation by highlighting and responding to this story.

from Stories by Jason Fried on Medium https://m.signalvnoise.com/my-kind-of-contract-e7327e98e3ea?source=rss-c030228809f2——2