Using Data As Part Of A User Centred Design Process
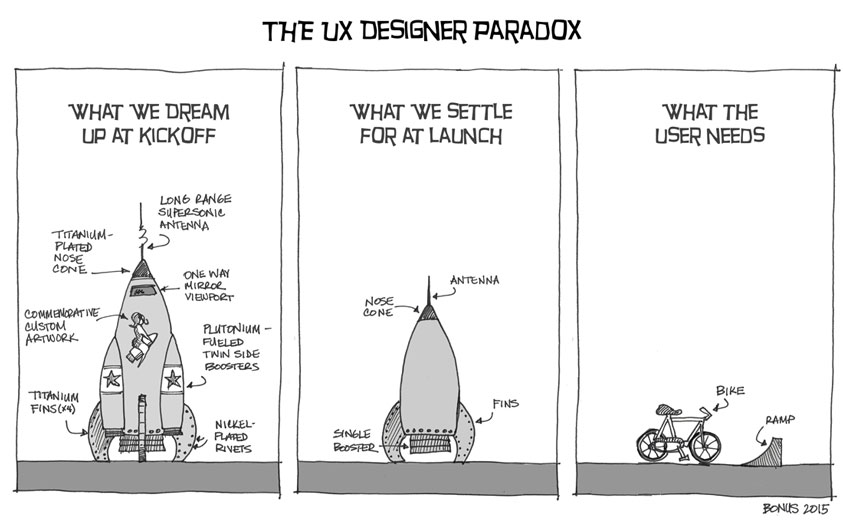
The Definition. User-centered design (UCD) is a framework of processes (not restricted to interfaces or technologies) in which the needs, wants, and limitations of end users of a product, service or process are given extensive attention at each stage of the design process.
When I started out as a web designer, I had no real understanding of what user experience design (UXD) meant, or even that it existed as a term. I was led into the industry through my passion for both e-commerce and graphic design.
As an entry level designer I realised I spent all my time diving into analytics to discover what I could about users of the site. I was really trying my hardest to undertake UX design without even realising I was doing so.
As my career has progressed I managed to move a lot closer to UX design and begun to undertake user testing as part of my design process. This is where my fascination with UXD & UCD really began and where I started to understand that analytics data can only be fully understood when the user provides context and true qualitative insight.
In this article I want to share a few things I’ve learnt along the way into how to use both the web analytics and user testing data throughout the design process and as part of continuous learning and improvement cycle to create the best possible products for your customers.
The Quantitative Insight
Quantitative insight can be gained by using analytics in the form of statistics, figures and reports to collate trends and patterns on user behaviour. Data leaves assumptions behind and provides us with facts.
In God We Trust, all Others Must Bring Data. W. Edwards Deming
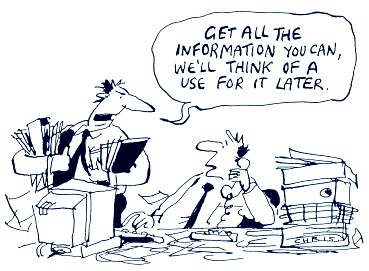
Data is insightful. All data however, needs context and needs to be validated with qualitative insight, from your users. You can collect all the data in the world, but in the wrong hands, assumptions will be made and you won’t know what to do with it.
Data is like garbage. You’d better know what you are going to do with it before you collect it. Mark Twain
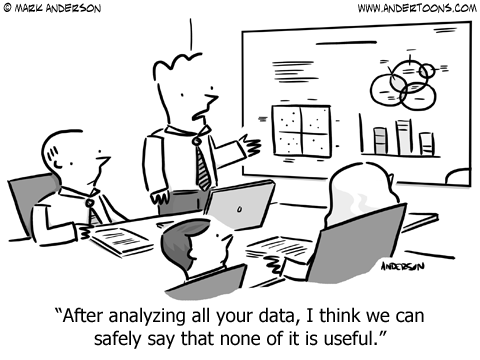
Diving into the analytics and quantitative research can often be a can of worms and will more than likely throw up more questions than you get answers. It’s important to try to stick to the specifics and try to focus on certain areas that are of the most significance.
The data you hold will then be more actionable and you will be able to use your findings to make decisions and to influence design.
Facts Do Not Cease To Exist Because They Are Ignored. Aldous Huxley
You cannot ignore data. Data rings true, it can help you get your point across. It can prove right or wrong and can enable you to be able to act upon your findings.
With the above said, it’s important to communicate data in a simple and understandable way to effectively to help get your point across to different areas of the business and senior stakeholders. When doing so however, the importance of backing up this qualitative insight with input from users must be stressed, the what must be framed with the why.
It’s important to balance between the quantitative data you have collected and use qualitative data through user centric research to not only validate your findings but to also either reinforce them or prove them wrong.
The Qualitative Insight
Qualitative insight is the best way to creating user centric designs and can be gained through many varying methods of data capture. There really is no substitute for one on one time with your users, however user testing doesn’t need to be so costly of time, money or resource. Insight can be gained through remote, online user testing, gaining voice of customer insight through surveys and questionnaires and so on.
You Are Not Your User And You Cannot Think Like A User Unless You’re Meeting Users Regularly. Leisa Reichelt
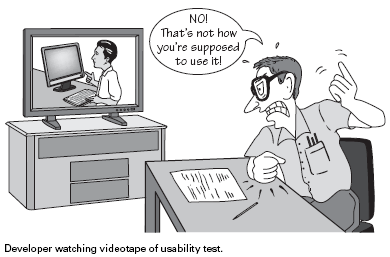
Having been involved in many user testing sessions both in-person and remote I have never once failed to be completely surprised by something that is said or done. Users will always be completely irrational and highlight problems, it’s all part of the test and learn cycle.
No matter how much user testing you do, you will never fail to be surprised, however you will also never be able to answer every single question or cater for all users. It’s important to stick to what’s most important for you, whether that be designing for personas or answering specific questions.
Not Everything That Can Be Counted Counts, And Not Everything That Counts Can Be Counted. Albert Einstein
Qualitative user research techniques provide invaluable insight that go far beyond the analytics. It’s important to test and validate at every stage of the design process. Then to continue to iterate and re-evaluate once a product has been shipped. Your first solution will almost certainly not be your final solution.
When People Talk, Listen Completely. Ernest Hemingway
One of the best pieces of advice I’ve ever heard used in the context of conducting user research is the above quote. No matter how proud or attached you are to a design, forget it, it’s useless unless you listen to the voice of the customer. Listen to their feedback and understand it to be able to shape your design progressively.
In Conclusion…
I’ve only scratched the surface here, although hopefully that has shared some insight. Using data can highlight the importance of key issues and can provide key insights. You can use it to influence and shape your designs. Though you must always ensure you are testing and validating with your users. Although you will never be able to design to suit the needs of every user, you should use personas and key demographics to help you target your designs. Once your product is live you must implement data and user research as part of a continuous test and learn cycle to keep improving and learning about your product.
Designing Charts — Principles Every Designer Should Know
Let’s talk about charts. Any designer who has worked on a project that requires some kind of data visualization knows that it can be an extremely difficult (and rewarding) design challenge.
I’ve been designing complex, data-heavy web and mobile apps for the past 15 years so I work with charts on a daily basis (see what I mean on Dribbble). Therefore, I want to share some of the design principles I use to build aesthetically pleasing and functional charts that users love.
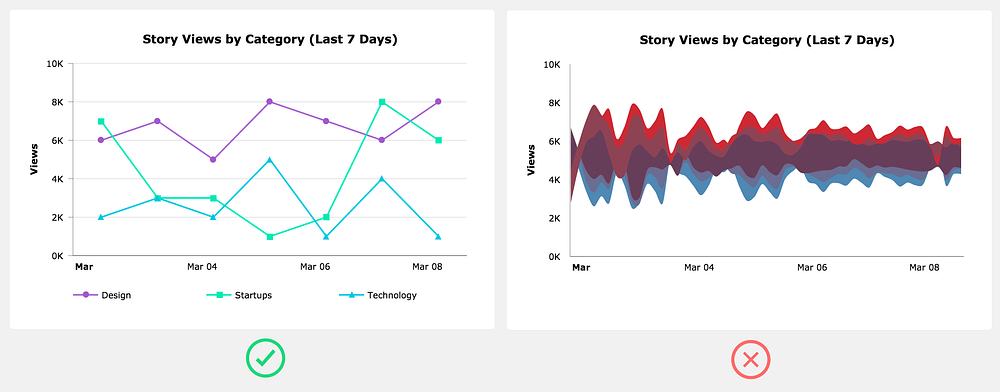
Use a familiar chart type
As a designer it can be a fun exercise to experiment with unique and strange chart types, such as a Streamgraph, but users shouldn’t have to learn how to read the chart you just invented. In most cases you should use one of the more common charts: area, bar/column, line, or pie/donut.
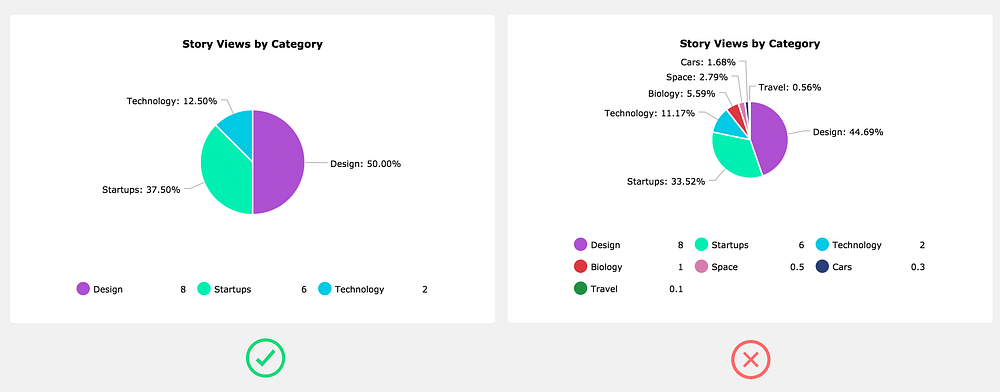
Add no more than 5 slices to a pie chart
As a general rule of thumb, if you really need to use a pie chart, try to keep the slices at five or less. The more slices in the pie chart, the more difficult it’s going to be to show the user a meaningful story. You’ll end up having to come up with goofy solutions to show the labels and make hover interactions work. Honestly, it’s usually easier just to avoid it altogether by using a different chart type.
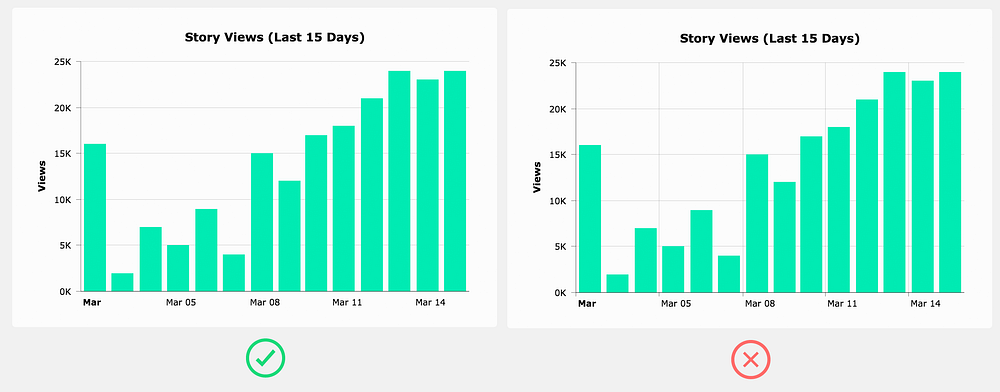
Order the data series
Unless you’re working with dates, you can greatly improve the readability of the chart by sorting the series either ascending or descending. This applies mainly to bar/column charts.
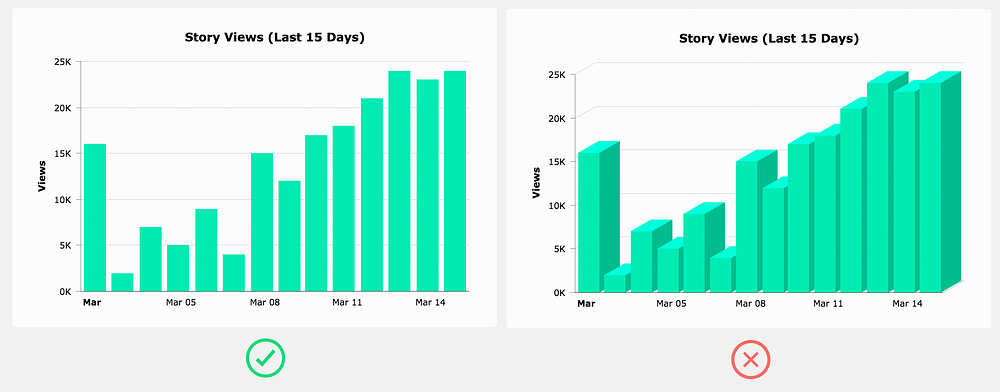
Avoid 3D charts
3D charts serve absolutely no practical purpose (unless you’re in VR maybe) — they don’t even look good.
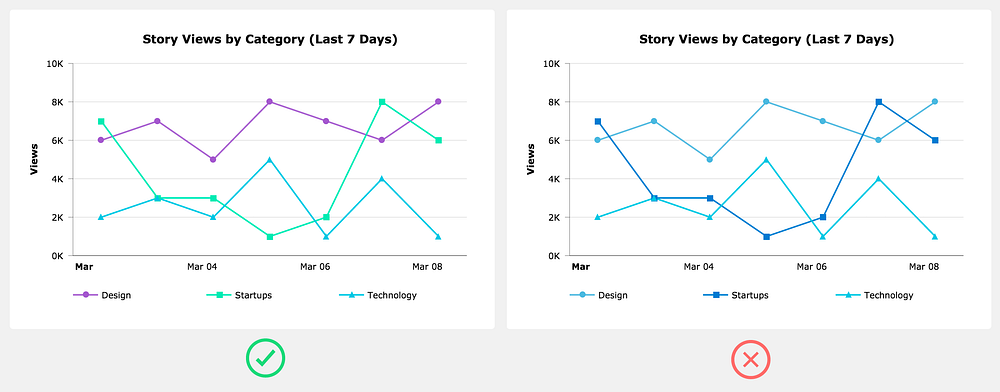
Don’t use randomly generated colors
Some charting frameworks will randomly generate data series colors. These algorithms rarely assign colors that both fit with the overall color scheme and provide enough visual distinction between data series. It’s best to come up with your own color scheme. Make sure you have enough colors for all the data series that could potentially be on the chart.
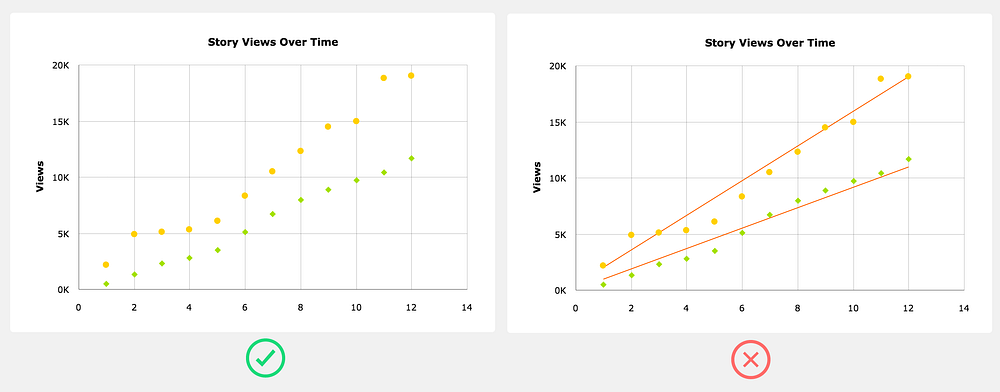
Trend lines are usually a distraction
Trend lines always seem like a great addition to a chart, but the truth is that they rarely provide anything the user can’t already see with the existing plotted data. If you decide to add a trend line, at the very least allow the user to toggle it off.
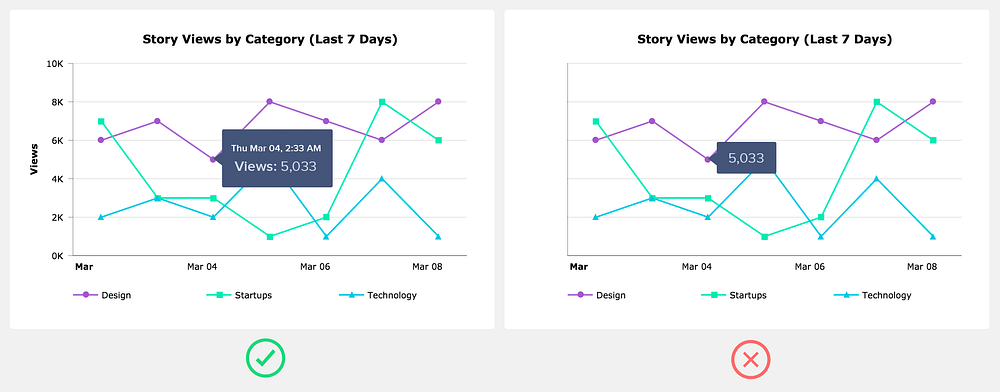
Don’t depend on tooltips
Think of tooltips as providing supplemental or expanded information. In other words, a tooltip shouldn’t be the only way a user can see the plotted value.
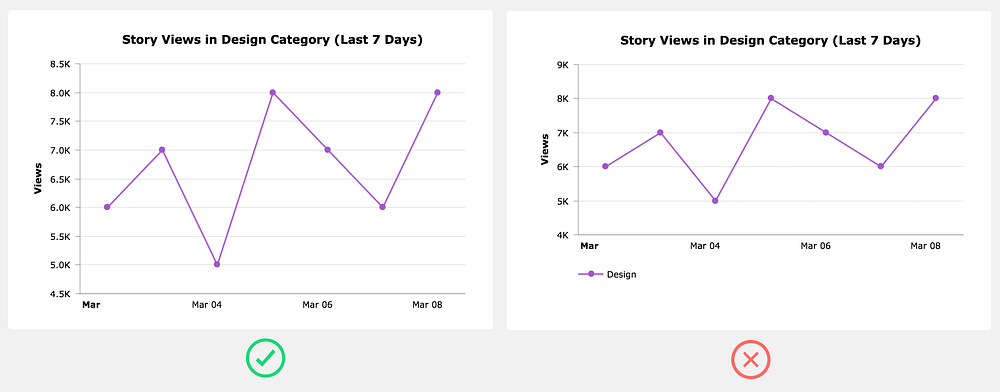
Don’t include a legend when it’s not needed
When you only have one data series, rather than adding a legend that takes up space, simply use the chart title to indicate the data that’s plotted.
Only use grid lines when it’s helpful
Grid lines can be helpful in guiding the user’s eyes from an axis label to the data point. However, grid lines usually aren’t necessary on simpler charts. When you do use grid lines, it’s important to decide if you need them on both the x-axis and the y-axis. Many times you only need it on one or the other.
Use real data in your chart mock ups
Designers have a tendency to create the most beautiful version of a chart possible without any regard to the real data that it needs to handle when it’s actually implemented.
This can cause endless headaches for the developers trying to build this thing you designed, and even more importantly, you haven’t even verified that the chart design will be practical in a real life situation.
The best solution is to create two versions of the design. The first version shows the chart in a state where the data is perfect, (i.e., optimized for purely aesthetic purposes). This design can be used for your portfolio and to present to potential clients. In the second version, use data that the chart is likely to display when it’s actually implemented. This is the design you can hand off to developers.
As a designer it’s your responsibility to use your best judgement and creativity when designing around data. However, data can be complex and creating a meaningful story around that data isn’t always cookie cutter.
You might find that the data you’re working with doesn’t play well with some of the principles outlined above — no problem, it’s ok to break the rules sometimes. The important thing is that you test your designs against real world situations.
And don’t forget the heart if you found the article helpful :)
Ryan Bales is the Founder & Creative Director at Bync.com. He has over 15 years of design experience with an emphasis on data visualization and designing for data heavy SaaS apps.
from uxdesign.cc – User Experience Design – Medium https://uxdesign.cc/designing-charts-principles-every-designer-should-know-5bd3969a0150?source=rss—-138adf9c44c—4
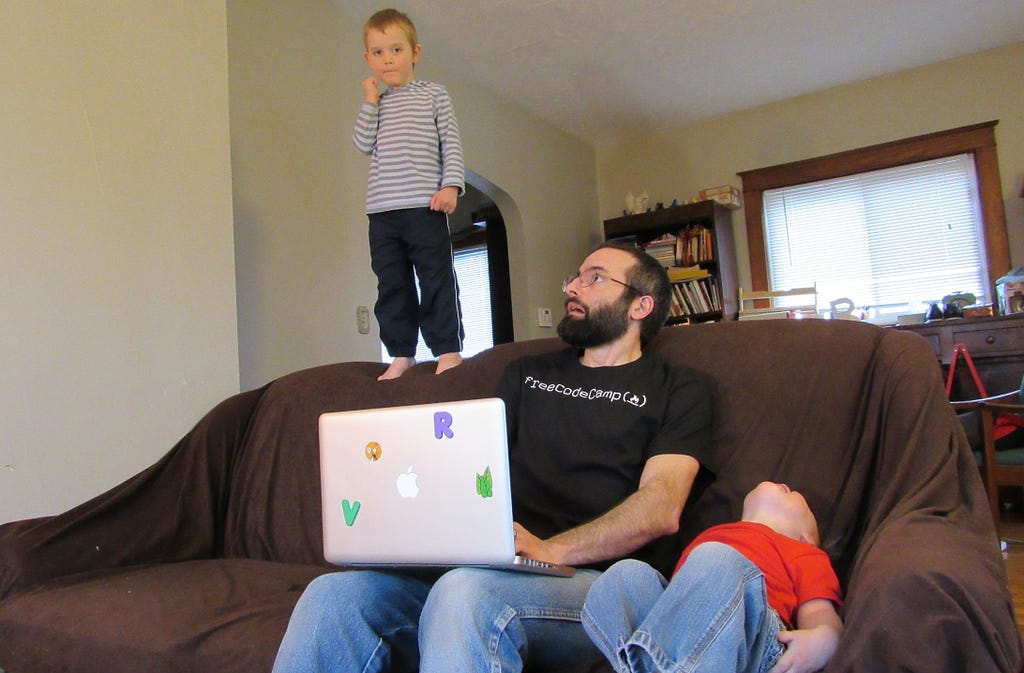
How I got a second degree and earned 5 developer certifications in just one year, while working and raising two kids
Me getting some work done while watching my kids.
“The standard pace is for chumps. The system is designed so anyone can keep up. If you’re more driven than ‘just anyone’ — you can do so much more than anyone expects. And this applies to ALL of life — not just school.” — Derek Sivers, founder of CD Baby
Learning to code can be challenging — especially when you also have a job and a family with small kids. Despite those things, I decided that the standard pace was not for me.
My goal in writing all this is not to brag — though I am extremely proud of these accomplishments. My goal is to convince you that the standard pace isn’t for you, either.
I’ve done a lot in the past year. I earned two Oracle Java Certifications, two CompTia Certifications, and freeCodeCamp’s Front End Certification. Each of these take most people many months of preparation, but I did them all in three weeks each.
And last but not least, I completed all the coursework necessary to earn a second Bachelor’s degree in software development from an accredited university, in less than six months.
I did this all while working full-time, spending time regularly with my wife and two young kids, and volunteering in my community.
One of the keys to accomplishing all of this was an amazing and supportive spouse. 😍
But there were also some other things that helped.
What’s Your Motivation?
After being a K-12 teacher for five years (with a teaching degree I was able to earn in two years), I realized I did not want to teach in a school the rest of my life.
I loved the teaching part of teaching, but I hated the forcing-kids-to-do-things-they-don’t-want-to-do part of teaching. Classroom management in my urban school district was very stressful for me. I was also becoming disenchanted with the whole educational system. We seem to be preparing students for jobs that will no longer exist.
I had always been interested in coding and even sometimes taught my students basic coding using Scratch and Code.org. I decided it was time to learn enough to do it full-time.
Wanting a new job was great motivation. Everyday I spent at my teaching job was an incentive to keep pushing myself towards my goal.
Research, research, research
It’s important not to rush into learning. Not all schools or learning resources are equal, and the wrong choice can make a big difference in your ability to meet your goals.
I tried to determine what learning method would work best for me and my family. While I know there are many ways to break into the tech industry, I decided on a somewhat traditional route: a Bachelor’s degree. I knew I had some classes already that would transfer into a new program. I looked into many school options but I decided on Western Governors University for the following reasons:
It is all online so I would not have to take time from my family for transportation.
You can work at your own pace, so I knew I could finish very quickly. As soon as you finish all the assignments and exams for one class, you can go immediately to the next class.
The degree included industry recognized certifications. I knew those would add to the credibility of my education.
Beating ambitions goals
At first, my goal was to finish my entire Bachelor’s degree in one year. One month into the program, I decided to revise my goal and finish in six months.
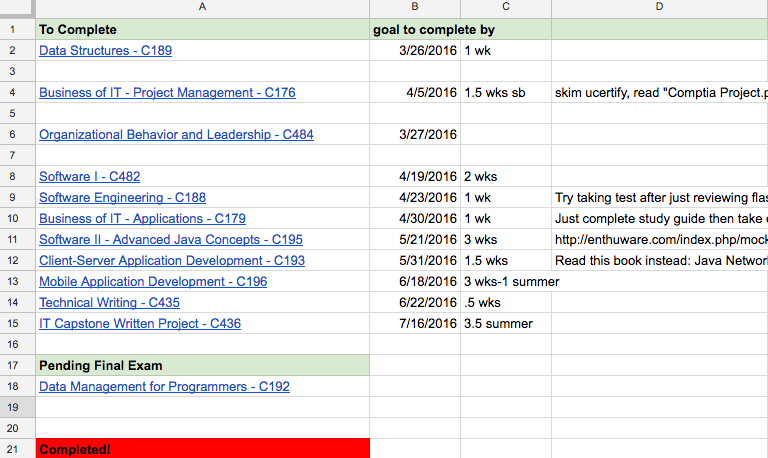
It was at this point that I did what helped me most in my goal to finish quickly: I made a schedule of the exact day I would finish each class so I could finish within 6 months.
I scheduled between 1 and 3 weeks for each class, depending on class requirements. I also made plans at that time about how I would finish each class very quickly. It was very helpful to have many subgoals throughout the learning process to make sure I stayed on track.
Section of actual spreadsheet I used to plan for classes.
Ambitious goals are important. These provided me additional motivation to push myself. A study by the Journal of Consumer Research showed that ambitious goals make people happier. I ended up meeting or surpassing all my self-imposed deadlines and that definitely made me happy!
Detailed schedule
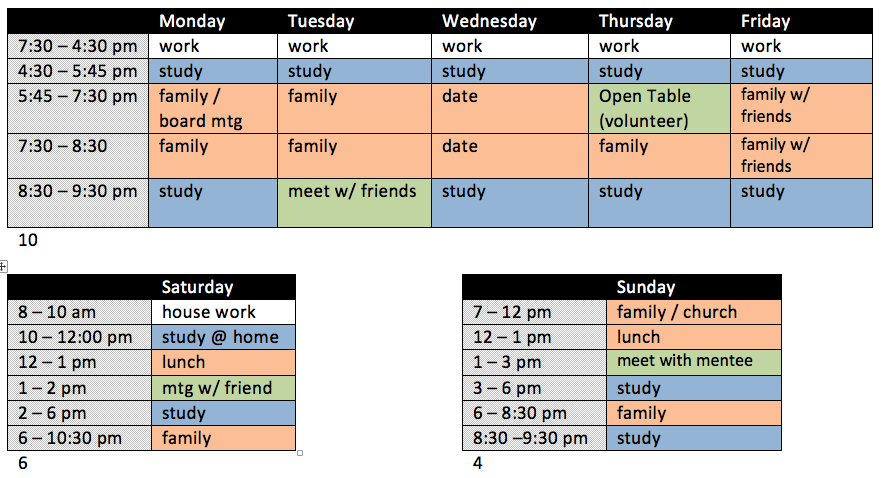
I created a detailed weekly schedule to help me spend a lot of time learning without neglecting my family and other responsibilities. I scheduled in family time, volunteering time, time with friends, and even a weekly date night!
The schedule I created at the beginning of my degree. I have an even more detailed schedule now.
A detailed schedule helped me make sure that my life stayed balanced. However, there is one thing I did not put on my schedule: television.
I watched only 3 episodes of television the entire time I worked on my degree. I had such a tight schedule to keep so I could meet my goals so I did not have time for TV. Also, any time spent watching television meant less time with my family. Since graduating, I have continued to limit television so I can focus on coding.
It was important for me to give things up in order to accomplish my goals.
Ignore the haters!
Every student at Western Governors University is assigned a mentor. Students have weekly calls with their mentors to help keep them on track. Whenever I shared my goals with my mentor she tried to encourage me to be a little more reasonable.
Well, instead of being more reasonable I decided to set more ridiculous goals. I know she had good intentions but I decided to ignore her warnings and stopped sharing my goals with her.
I have found that it is sometimes helpful to not share goals with certain people if they are not going to be encouraging.
Maximizing time
Besides my scheduled time to learn software development, I also found ways to fit in even more studying. For instance, I used most of my lunch breaks to study. Also, I often carried notes in my pocket that I could review whenever I had a free moment.
Another thing I did (and still do) was to take days off my teaching job to work on my classes or programming projects. While completing my degree, I planned my days off to line up in my schedule when I knew I had harder classes to pass.
I try to be constantly reevaluating my schedule and how I spend my time so I can have greater effectiveness.
I used to code a lot after my kids went to bed. However, I noticed that by the end of the day, my brain just did not work as well. I switched up my sleep schedule so I now go to bed around 9pm and wake up at 4am to code (and create training videos). This may sound a little crazy but it has greatly increased my productivity.
Learn what others do
I spent a lot of time on the Reddit page for my college and various forums reading about what others did that helped them with their classes. For the industry certifications, there were even more resources available to help. This allowed me to better plan the quickest way to finish.
There is almost always someone out there who has gone before you, and it’s important to identify them and learn from them.
Learning from others was also very helpful while going through the freeCodeCamp curriculum. Experienced people in the community are always willing to help or offer suggestions in their forums and community chat rooms.
Just ship it!
Shipping means to send out a completed product.
There were many times when I wondered if I needed to put in more time working on projects or studying. Then I would realize that I didn’t have time if I wanted to meet my self-imposed deadlines.
My deadlines forced me to act before I felt completely ready, and this definitely paid off.
I’ve found that it’s more important to get projects out there than to make them perfect. If you try to make sure everything is just right, you may never finish. When in doubt, just ship it!
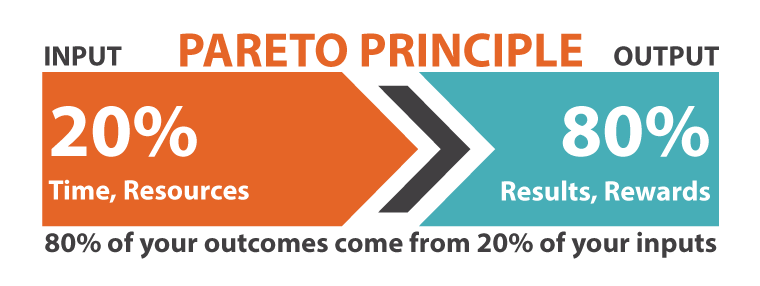
The 80/20 Rule
The 80/20 rule states that for many events, roughly 80% of the effects come from 20% of the causes. When learning software development, this means that about 20% of the learning content will contain about 80% of what you will actually use. You can save a lot of time if you just focus on the top 20%.
For my degree, I only read between 20–30% of the required content. According to the 80/20 rule, this was enough to understand over 80% of the subject matter.
The trick is determining which 20% to focus on. I would often ask myself, “If I were designing the exam, would I include this material?”
Really, when learning anything, you should ask yourself if it is part of the 20% of learning content that will give you 80% of value.
This relates to the idea of just-in-time information. It’s usually not beneficial to learn something that you don’t plan to use in the near future, especially when your memory is as bad as mine. 😊 When working on projects I try to learn what I will need just for that project.
Employers often care more about projects you’ve created than how you learned to code. Keeping this fact in mind will help you decide how to best use your time.
Keeping things moving forward
I didn’t take any time off from learning once my degree was finished. I realized the importance of projects, so I went straight into freeCodeCamp and started creating personal projects to build up my portfolio. I was able to continue to apply all of the strategies that I used while completing my Bachelor’s degree.
I also continued to use these strategies when I decided to start creating JavaScript training videos. Now I’m posting JavaScript training videos almost every day on the freeCodeCamp YouTube channel.
If you’re interested in the specific things I did for each class to finish my WGU degree quickly, you can check out this blog post.
I hope some of the strategies I used can also be helpful to you, even if your life is as busy as mine.
Remember: the standard pace is for chumps. You can do better!
from freeCodeCamp https://medium.freecodecamp.com/how-i-got-a-second-degree-and-earned-5-developer-certifications-in-just-one-year-while-working-and-2b902ee291ab?source=rss—-336d898217ee—4
from freeCodeCamp https://medium.freecodecamp.com/why-american-farmers-are-hacking-their-tractors-with-ukrainian-firmware-488029e07cac?source=rss—-336d898217ee—4
Bitcoin is the currency of the Internet: a distributed, worldwide, decentralized digital money. Unlike traditional currencies such as dollars, bitcoins are issued and managed without any central authority whatsoever: there is no government, company, or bank in charge of Bitcoin. As such, it is more resistant to wild inflation and corrupt banks. With Bitcoin, you can be your own bank.
Do not use URL shortening services: always submit the real link.
Begging/asking for bitcoins is absolutely not allowed, no matter how badly you need the bitcoins. Only requests for donations to large, recognized charities are allowed, and only if there is good reason to believe that the person accepting bitcoins on behalf of the charity is trustworthy.
News articles that do not contain the word “Bitcoin” are usually off-topic. This subreddit is not about general financial news.
Submissions that are mostly about some other cryptocurrency belong elsewhere. For example, /r/CryptoCurrency is a good place to discuss all cryptocurrencies.
Promotion of client software which attempts to alter the Bitcoin protocol without overwhelming consensus is not permitted.
No referral links in submissions.
No compilations of free Bitcoin sites.
Trades should usually not be advertised here. For example, submissions like “Buying 100 BTC” or “Selling my computer for bitcoins” do not belong here. /r/Bitcoin is primarily for news and discussion.
Please avoid repetition — /r/bitcoin is a subreddit devoted to new information and discussion about Bitcoin and its ecosystem. New merchants are welcome to announce their services for Bitcoin, but after those have been announced they are no longer news and should not be re-posted. Aside from new merchant announcements, those interested in advertising to our audience should consider Reddit’s self-serve advertising system.
Do not post your Bitcoin address unless someone explicitly asks you to.
Bitcoin Core is the backbone of the Bitcoin network. Almost all Bitcoin wallets rely on Bitcoin Core in one way or another. If you have a fairly powerful computer that is almost always online, you can help the network by running Bitcoin Core. You can also use Bitcoin Core as a very secure Bitcoin wallet.
We previously collected donations to fund Bitcoin advertising efforts, but we no longer accept donations. The funds already donated will be spent on some sort of advertising, as intended. As of now, 10.35799117 BTC was spent out of 22.51357574. If you have ideas for the remaining BTC, see here for more info.
from Bitcoin on Reddit https://www.reddit.com/r/Bitcoin/comments/60elrh/ibm_launches_enterpriseready_blockchain_service/
Google open-sources JPEG encoder that reduces file sizes by 35%
If you’re building an app or site that stores, manipulates or serves a lot of images, you’ll want to consider implementing Google’s new image compression algorithm, which promises to reduce JPEG file sizes by 35 percent more than other methods.
It’s called Guetzli, and it works with existing browsers and image processing tools. Google says it allows for small file sizes without compromising much on image quality by targeting what’s known as the quantization stage of the compression process, which is where algorithms can squish files but end up with poorer quality images.
“This event was off the charts”
Gary Vaynerchuk was so impressed with TNW Conference 2016 he paused mid-talk to applaud us.
However, it’s worth noting that Guetzli is slower than other options out there. Its psychovisual model “approximates color perception and visual masking in a more thorough and detailed way than what is achievable by simpler color transforms and the discrete cosine transform,” and the search algorithm that Guetzli uses to achieve this is slower than alternatives like libjpeg.
In the examples below, you can see the uncompressed original image on the left, libjpeg in the middle and Guetzli’s result on the right; notice how Google’s solution has less ringing artifacts in both examples.
The JPEG encoder is open-source and available for you to download and implement in your own projects from this GitHub repository.
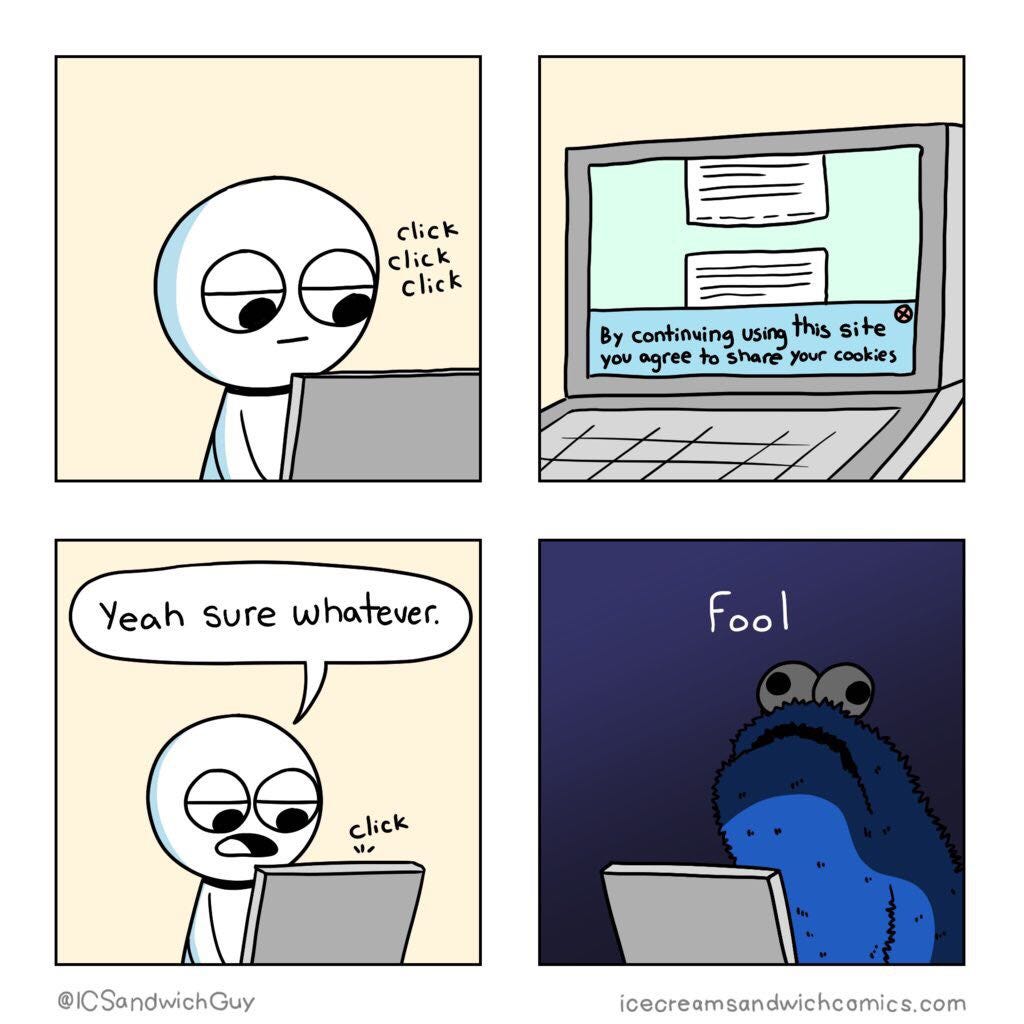
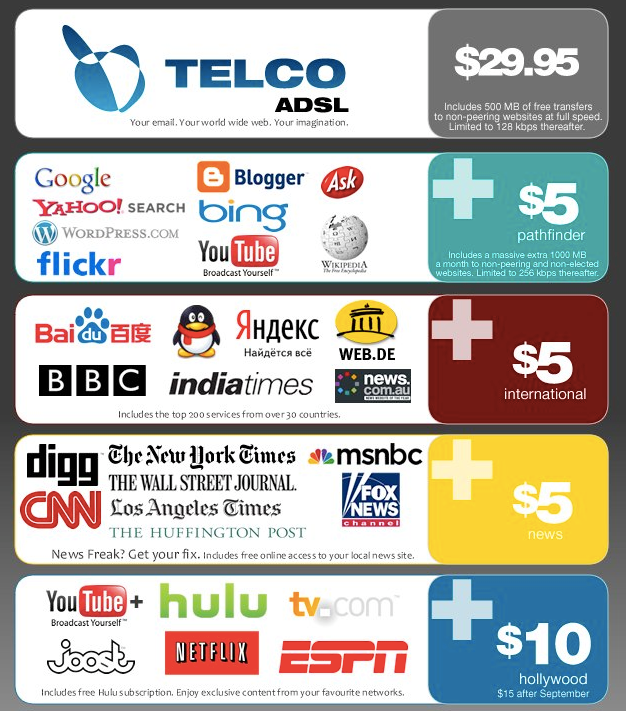
There are a lot of scary things happening these days, but here’s what keeps me up late at night. A handful of corporations are turning our open internet into this:
These corporations want to lock down the internet and give us access to nothing more than a few walled gardens. They want to burn down the Library of Alexandria and replace it with a magazine rack.
Why? Because they’ll make more money that way.
This may sound like a conspiracy theory, but this process is moving forward at an alarming rate.
History is repeating itself.
So far, the story of the internet has followed the same tragic narrative that’s befallen other information technologies over the past 160 years:
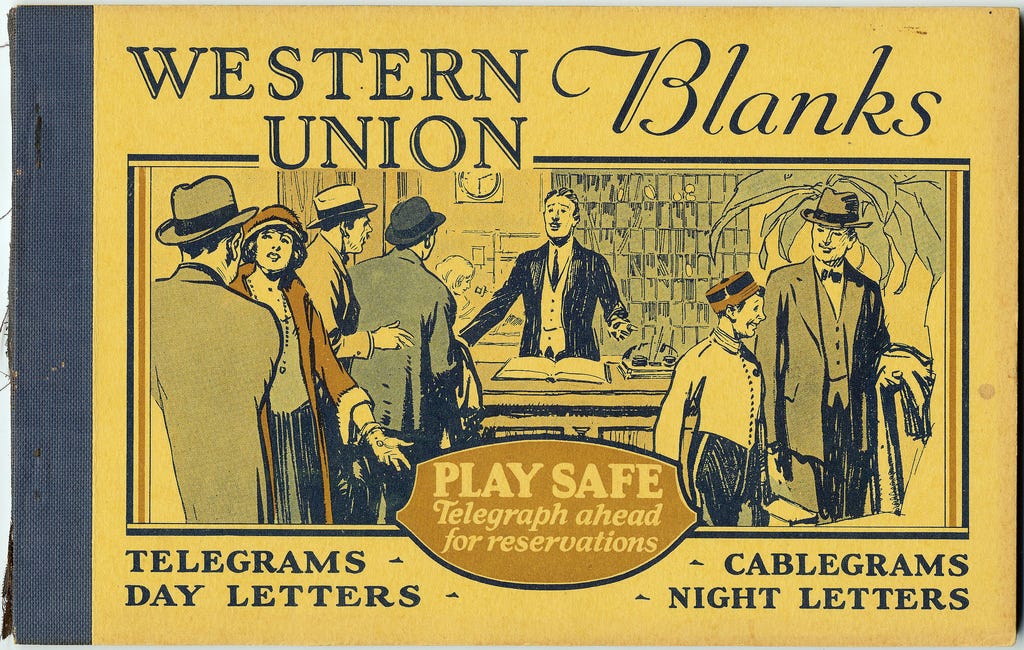
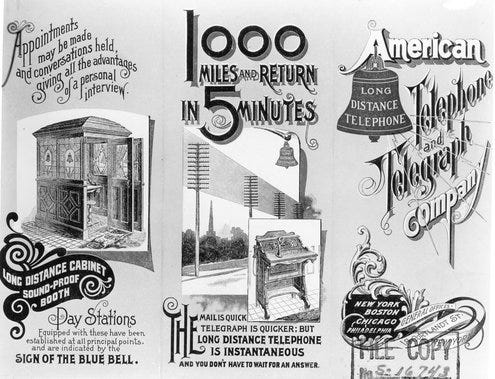
the telegram
the telephone
cinema
radio
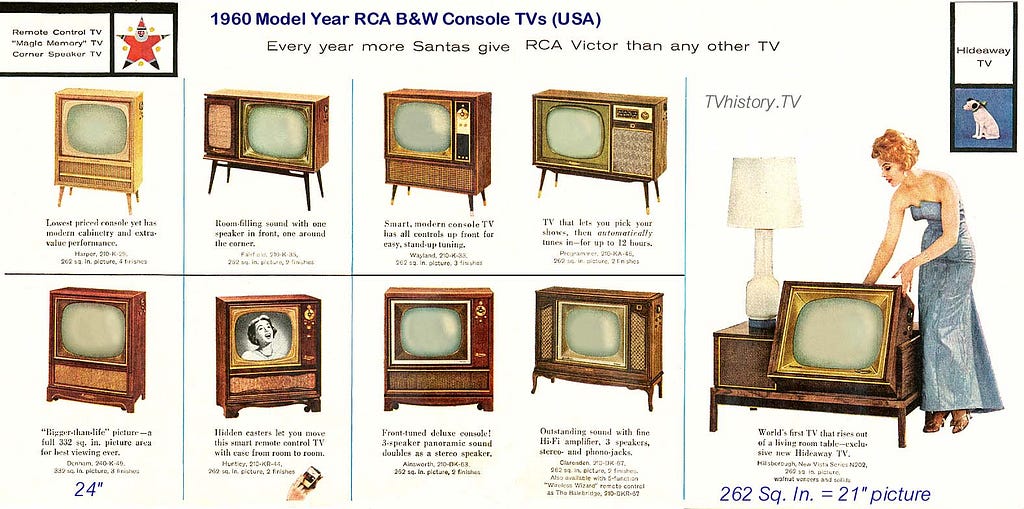
television
Each of these had roughly the same story arc:
Inventors discovered the technology.
Hobbyists pioneered the applications of that technology, and popularized it.
Corporations took notice. They commercialized the technology, refined it, and scaled it.
Once the corporations were powerful enough, they tricked the government into helping them lock the technology down. They installed themselves as “natural monopolies.”
After a long period of stagnation, a new technology emerged to disrupt the old one. Sometimes this would dislodging the old monopoly. But sometimes it would only further solidify them.
This loop has repeated itself so many times that Tim Wu — the Harvard law professor who coined the term “Net Neutrality” — has a name for it: The Cycle.
“History shows a typical progression of information technologies, from somebody’s hobby to somebody’s industry; from jury-rigged contraption to slick production marvel; from a freely accessible channel to one strictly controlled by a single corporation or cartel — from open to closed system.” — Tim Wu
And right now, we’re in step 4 the open internet’s narrative. We’re surrounded by monopolies.
The problem is that we’ve been in step 4 for decades now. And there’s no step 5 in sight. The creative destruction that the Economist Joseph Schumpeter first observed in the early 1900s has yet to materialize.
The internet, it seems, is special. It’s the ultimate information technology — capable of supplanting the telegram, telephone, radio, cinema, television, and much more — and there’s no clear way to disrupt it.
But the war for the commanding heights of the internet is far from over. There are many players on this global chess board. Governments. Telecom monopolies. Internet giants like Google and Facebook. NGOs. Startups. Hackers. And — most importantly — you.
The war for the open internet is the defining issue of our time. It’s a scramble for control of the very fabric of human communication. And human communication is all that separates us from the utopia that thousands of generations of our ancestors slowly marched us toward — or the Orwellian, Huxleyan, Kafkaesque dystopia that a locked-down internet would make possible.
By the end of this article, you’ll understand what’s happening, the market forces that are driving this, and how you can help stop it. We’ll talk about the brazen monopolies who maneuver to lock down the internet, the scrappy idealists who fight to keep it open, and the vast majority of people who are completely oblivious to this battle for the future.
In Part 1, we’ll explore what the open internet is and delve into the history of the technological revolutions that preceded it.
In Part 2, we’ll talk about the atoms. The physical infrastructure of the internet. The internet backbone. Communication satellites. The “last mile” of copper and fiber optic cables that provide broadband internet.
In Part 3, we’ll talk about bits. The open, distributed nature of the internet and how it’s being cordoned off into walled gardens by some of the largest multinational corporations in the world.
In Part 4, we’ll explore the implications of all this for consumers and for startups. You’ll see how you can help save the open internet.I’ll share some practical steps you can take as a citizen of the internet to do your part and keep it open.
This is a long read. So grab a hot beverage and get ready to download a massive corpus of technology history into your brain.
Part 1: What is the open internet?
“Number 31” by Jackson Pollack. 1950. Household paints on canvas.
There’s only one word to describe the open internet: chaos.
The open internet is a cacophony of 3 billion voices screaming over one another. It’s a dusty, sprawling bazaar. And it’s messy. But it has produced some of the greatest art and industry of our time.
The open internet is a Miltonian marketplace of ideas, guided by a Smithian invisible hand of free-market capitalism.
The open internet is distributed. It’s owned in part by everyone and in whole by no one. It exists largely outside of the boundaries of governments. And it’s this way by design.
This reflects the wisdom of Vint Cerf, Bob Khan, J. C. R. Licklider, and all the wizards who stayed up late and pioneered the internet. They had seen the anti-capitalist, corporatists fate that befell the telegram, the telephone, the radio, and the TV. They wanted no part of that for their invention.
The open internet is a general purpose tool where anyone can publish content, and anyone can then consume that content. It is a Cambrian Explosion of ideas and of execution.
Can these websites survive in a top-down, command-and-control closed internet? Will they pay for “shelf space” on a cable TV-like list of packages? Will they pay for a slice of attention in crowded walled garden?
We’re all trapped in The Cycle
Here’s a brief history of the information technologies that came before the internet, and how quickly corporations and governments consolidated them.
Originally anyone could string up some cable, then start tapping out Morse Code messages to their friends. The telegram was a fun tool that had some practical applications, too. Local businesses emerged around it.
That changed in 1851 when Western Union strung up transcontinental lines and built relay stations between them.
If small telegraph companies wanted to be able to compete, they needed access to Western Union’s network. Soon, they were squeezed out entirely.
At one point Western Union was so powerful that it was able to single-handedly install a US President. If you grew up in America, you may have memorized this president’s name as a child: Rutherford B. Hayes.
Not only did Western Union back Hayes’ campaign financially, it also used its unique position as the information backbone for espionage purposes. It was able to read telegrams from Hayes’ political opponents and make sure Hayes was always one step ahead.
Western Union’s dominance — and monopoly pricing — would last for decades until Alexander Graham Bell disrupted its business with his newly-invented telephone.
How the telephone fell victim to The Cycle
After a period of party lines and local telephone companies, AT&T — backed by JP Morgan — built a network of long-distance lines throughout America.
In order for the customers of local phone companies to be able to call people in other cities, those companies had to pay AT&T for the privilege of using its long-distance network.
Theodore Vale — a benevolent monopolist if there ever was one — thought that full control of America’s phone systems was the best way to avoid messy, wasteful capitalistic competition. He argued that his way was better for consumers. And to be fair, it was. At least in the short run.
Vale was able to use AT&T’s monopoly profits to subsidize the development of rural phone lines. This helped him rapidly connect all of America and unify it under a single standardized system.
But the problem with benevolent monopolists is they don’t live forever. Sooner or later, they are replaced by second-generation CEOs, who often lack any of their predecessors’ idealism. They are only after one thing — the capitalist’s prerogative — maximizing shareholder value. That means making a profit, dispersing dividends, and beating quarterly earnings projections. Which means extracting as much money from customers as possible.
AT&T eventually squeezed out their competitors completely. And once AT&T’s monopoly became apparent, the US Government took action to regulate it. But AT&T was much smarter than its regulators, and jumped on an opportunity to become a state-sponsored “natural monopoly.”
AT&T would enjoy monopoly profits for decades before being broken up by the FCC in 1982.
But the “baby bells” wouldn’t stay divided for long. In 1997, they were able to start merging back together into a corporation even bigger than before the break-up.
The end result is one of the most powerful corporations on the planet — strong enough to expand its monopoly from the land-line telephone industry to the emerging wireless telecom industry.
AT&T functioned like a branch of government and had extensive research labs, but with one major exception — it could keep secret any inventions that it perceived as a threat to its core business.
Voicemail — and digital tape, which was later used as a critical data storage medium for computers — was actually invented within one of AT&T’s labs in 1934. But they buried it. It was only re-invented decades later.
Imagine how much progress the field of information technology could have made during that length of time with such a reliable and high-volume data storage medium at its disposal.
To give you some idea of how much just this one AT&T decision may have cost humanity, imagine that a corporation purposefully delayed the introduction of email by a decade. What would be the total impact on the productivity of society? How many trillions of dollars in lost economic activity would such an action cost us? This is the cautionary tale of what happens you leave scientific research and development to private industry instead of public labs and universities.
You can still feel the legacy of AT&T’s monopoly when you call an older person from out of state. They will instinctively try to keep the call as short as possible, because they want to avoid the massive long distance fees historically associated with such calls, even though these no longer apply.
I thought this was just my grandmother, but it’s everyone’s grandmother. Entire generations have been traumatized by AT&T’s monopolistic pricing.
How cinema fell victim of The Cycle
Shortly after the invention of cinema, we had thousands of movie theaters around the US showing a wide variety of independently-produced films on all manner of topics. Anyone could produce a film, then screen it at their local theater.
That changed when Adolf Zukor founded Paramount Pictures. He pioneered the practice of “block booking.” If small independent theaters wanted to screen, say, the newest Mae West film, they would also need to purchase and screen a bunch of other lessor films.
This took away theater owners’ status as local tastemakers, and removed their ability to cater to their own local demographics. The result was the commoditization of movie theaters, and ultimately the rise of blockbuster cinema.
How radio fell victim to The Cycle
Shortly after Marconi — or Tesla — invented the radio, a massive hobbyist movement sprung up around it. There were thousands of local radio stations playing amateur programs.
In stepped David Sarnoff as the head of the Radio Corporation of America (RCA). He was perhaps the most Machiavellian CEO of the 20th century.
At the time, RCA was making parts for radio. Conventional thinking at the time was that RCA should focus on hardware, and getting as many radio stations running and as many radios into homes as possible. But Sarnoff realized that the real money was in content. He helped popularize the National Broadcast Corporation (NBC) and focused instead on making money through advertisements.
Then Sarnoff approached the Federal Radio Commission — now the Federal Communications Commission (FCC) — and convinced them that since the radio spectrum was a scarce commodity, they should carve it up and issue licenses.
Soon, NBC was available in every home, and the local hobbyist radio stations were squeezed off the air. RCA was now vertically integrated — from the parts in the radio stations, to the parts in consumer radios, to the content being broadcast itself.
Sarnoff had talked with the inventors of TV, and knew that it would eventually disrupt radio. But he had a plan. To claim the invention of television for himself.
How TV fell victim to The Cycle
TV is different from other forms of technology here, in that it didn’t enjoy a hobbyist stage. With the help of the FCC, Sarnoff and RCA immediately locked TV down. The result was several decades where Americans had just three channels to choose from — NBC, CBS, and ABC.
This was the height of mass culture — half of all Americans watching the same episode of I Love Lucy at the same time. The popularity of television — combined with the lack of diversity in programming caused by this monopoly — had social and political consequences that haunt us to this day.
Will the open internet fall victim to The Cycle?
We’ve gone through the invention step. The infrastructure came out of DARPA and the World Wide Web itself came out of CERN.
We’ve gone through the hobbyist step. Everyone now knows what the internet is, and some of the amazing things it’s capable of.
We’ve gone through the commercialization step. Monopolies have emerged, refined, and scaled the internet.
But the question remains: can we break with the tragic history that has befallen all prior information empires? Can this time be different?
Part 2: The War for Atoms
“IBM Cable Ball” by David Lan. 2007. Cables.
“Any sufficiently advanced technology is indistinguishable from magic.” — Arthur C. Clarke’s Third Law
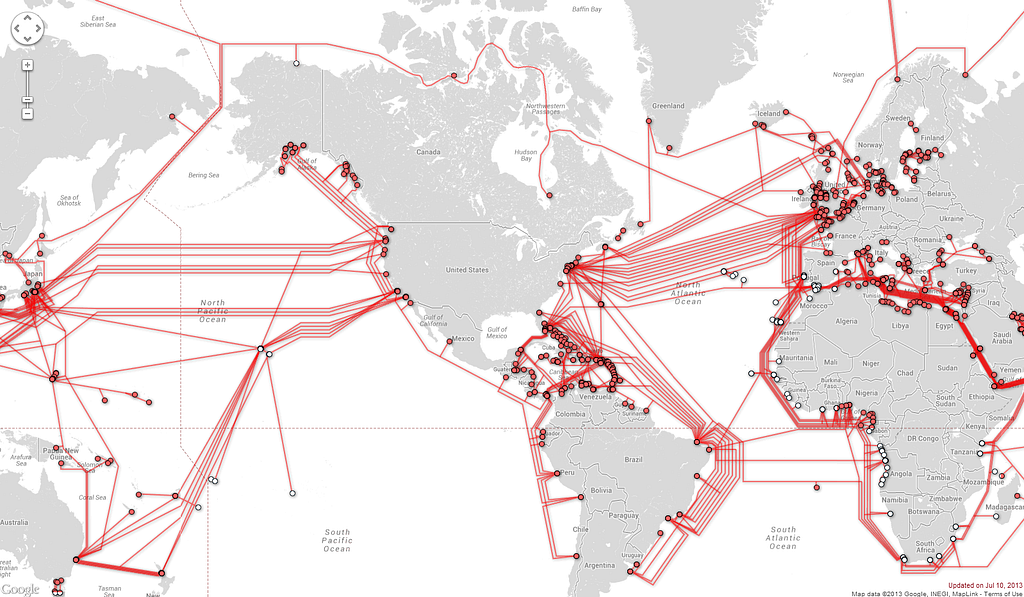
As much as we may think of the internet as a placeless realm of pure abstractions, it has a physical structure. It’s not magic. And more people are waking up to this reality each day.
The internet is a series of copper and fiber optic cables that burrow through the ground and tunnel under oceans. We call this the Internet Backbone. Here’s what it looks like:
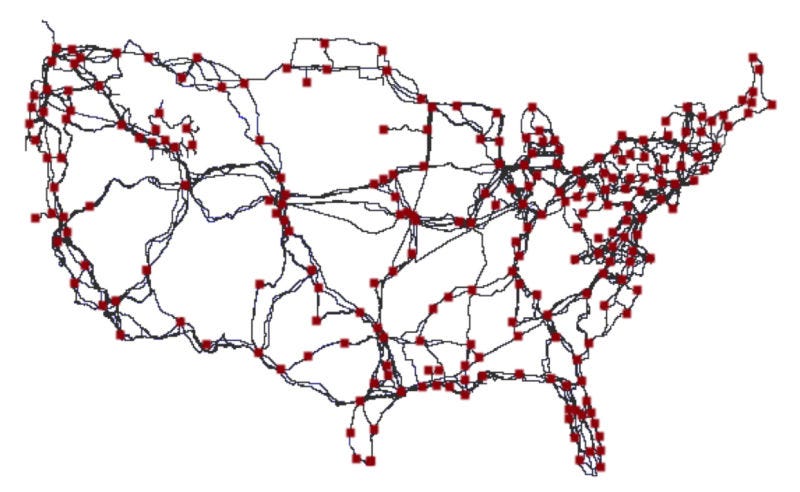
The internet is then further distributed through regional backbones. Here’s all the fiber that carries internet data around the United States. Red squares represent the junctions between “long haul” fibers.
The invisible workhorses of the internet: backbone providers
Six major companies control the backbone, and they “hand off” traffic from one another without any money exchanging hands:
Level 3 Communications
Telia Carrier
NTT
Cogent
GTT
Tata Communications.
Within the US, the backbone is mostly controlled by old long distance carriers, including Verizon and AT&T — who also control a two thirds of America’s $200 billion wireless industry.
These companies “peer” traffic through backbone connections controlled by other companies, or pay each other through “transit agreements.”
Despite the involvement of these huge telecoms, the internet backbone represents a fairly healthy market. About 40% of the internet’s backbone is controlled by smaller networks you’ve never heard of.
The mafia of the internet: the ISPs
The broadband internet market, on the other hand, isn’t healthy at all. This is the “last mile” of cables that plug into the internet backbone. And it’s full of ugly tollbooths, guarded by thick benches of lawyers and lobbyists.
This broadband internet market is controlled by just three extremely powerful — and widely hated — internet service providers (ISPs):
Cox
Charter (which recently acquired another ISP, Time Warner)
These two providers control 2/3rd of the wireless market. If you have a mobile phone, there’s a good chance you pay one of these companies every month for your data plan.
These ISPs control millions of miles of copper cables that they buried in the ground back in the 1970s, and satellites they shot up into orbit in the 1990s. They constantly breakthelaw, tie up regulators in lengthy court battles, and make it practically impossible for anyone — even Google — to enter their markets.
The ISPs do all this for one reason and one reason alone: so they can avoid free market competition — and the expensive technology upgrades it would require — while they continue raking in their monopoly rents from the 2/3 of Americans who only have one choice in their neighborhood for broadband internet.
For the past two years, the public had a weapon against these ISPs. It’s not one that can mortally wound them , but it has helped beat back their monopolistic tendencies. It’s called Net Neutrality.
How Net Neutrality works
The story of ISPs basically comes down to this: They used to make a ton of money off of cable packages. But people discovered that once they had the internet, they didn’t care about cable TV any more — they just wanted data plans and so they could watch YouTube, Netflix, or whatever shows they wanted — and they could also consume a lot of non-video content, too.
The ISPs don’t make nearly as much selling you a data plan as they used to make selling you a cable plan, though. So their goal is to return to the “good old days” by locking down the internet into “channels” and “bundles” then forcing you to buy those.
How do we prevent this? The good news is that we already have. In 2015, the FCC passed a law that regulated ISPs as utilities. This is based on the principle of “Net Neutrality” which basically states that all information passing through a network should be treated equally.
As part of its 2015 decision on Net Neutrality, the FCC asked for public comment on this topic. 3 million Americans wrote to the FCC. Less than 1% of those people were opposed to Net Neutrality.
After a hard fought battle against telecoms, we convinced the FCC to enshrine Net Neutrality into law.
The FCC’s Title II regulation created three “bright lines” that prevent ISPs from doing the following:
Blocking content from websites
Slowing down content from websites
Accepting money from websites to speed up their content
These rules made it so that no matter how rich and powerful a corporation is — and Apple and Google are the biggest corporations on Earth, and Microsoft and Facebook aren’t far behind — they can’t buy priority access to the internet.
Everyone has to compete on a level playing field. These tech conglomerates have to compete with the scrappy startups, the mom-and-pop businesses, and even independent bloggers who are running WordPress on their own domain.
Nobody is above Net Neutrality. It’s as simple a tool as possible for protecting the capitalist free market internet from monopolies who would otherwise abuse their power.
Now ISPs are treated like a utility. How are the packets being routed through a network different from the water being piped through the ground, or the electricity flowing through a power grid?
The water company shouldn’t care whether you’re turning on a tap to wash dishes or to take a shower.
The power company shouldn’t care whether you’re plugging in a TV or a toaster.
The ISPs shouldn’t care what data you want or what you use it for.
The reason ISPs want to get rid of Net Neutrality is simple: if we stop treating them like the utility that they are, they can find ways to charge a lot more money.
Here’s the former CEO of AT&T laying out his evil plan:
“Now what they would like to do is use my pipes free, but I ain’t going to let them do that because we have spent this capital and we have to have a return on it. So there’s going to have to be some mechanism for these people who use these pipes to pay for the portion they’re using. Why should they be allowed to use my pipes? The Internet can’t be free in that sense, because we and the cable companies have made an investment and for a Google or Yahoo! or Vonage or anybody to expect to use these pipes [for] free is nuts!” — Edward Whitacre, AT&T CEO
What he should certainly realize is that everyone is already paying for internet access. You’re paying to be able to access this article. I’m paying to push this article up onto the internet. This website is paying to send the traffic from its servers over to your computer.
We have all already paid to use these ISP’s last mile of cables. No one is using these pipes for free.
But the ISPs see an opportunity to double dip. They want to charge for bandwidth, and also charge websites what the Mafia calls “protection money.” They essentially want to be able to say to website owners: “Those are some lovely data packets you’ve got there. It sure would be a shame if they got lost on their way to your users.”
Of course, most of the open internet couldn’t afford to pay this “protection money” to ISPs, so the ISPs would block traffic to their websites, cutting consumers off from most of the open internet. But the ISPs wouldn’t need to block these websites. All the ISPs would need to do is introduce a slight latency.
Both Google and Microsoft have done research that shows that if you slow down a website by even 250 milliseconds — about how long it takes to blink your eyes — most people will abandon that website.
That’s right — speed isn’t a feature, it’s a basic prerequisite for attracting an audience. We humans are extremely impatient and becoming more so with each passing year.
This means that in practice, if an ISP artificially slows down a website, it’s practically as damaging as blocking the site entirely. Both of these acts result in the same outcome — a severe loss of traffic.
Traffic is the lifeblood of websites. Without traffic, merchandise doesn’t get sold. Services don’t get subscribed to. Ads don’t get seen.
Without traffic, the open web dies — whether ISPs block it or not.
The ISPs have launched an all-out assault on Net Neutrality
With January’s change in US administration and the election of our 45th president, the FCC has changed as well.
The FCC Chairman Ajit Pai — a former Verizon lawyer — is now in control of the only regulator that the ISPs answer to. And here’s a direct quote from him:
“We need to fire up the weed whacker and remove those rules that are holding back investment, innovation and job creation.” — FCC Chairman Ajit Pai
The ISPs won’t reinvest their “protection money” in infrastructure. They already have incredible monopoly profits. Here’s their net income (after-tax profits) from 2016:
AT&T: $16 billion
Verizon: $13 billion
Comcast $8 billion
Charter $8 billion
They have plenty of profit they could claw back into improving infrastructure. They’re choosing instead to disperse this money to shareholders.
In just two months, Chairman Pai has already done incredible damage to Net Neutrality. He dropped “Zero Rating” lawsuits against 4 monopolies who were in clear violation of Net Neutrality law. Now Comcast and AT&T can continue to stream their own video services without them counting toward customers’ data caps, and there’s nothing the FCC will do about it.
Former FCC Chairman Tom Wheeler did his best to reach out to Chairman Pai and convince him of the virtues of Net Neutrality. The two were scheduled to meet once every two weeks during Wheeler’s last 18 months in office. But Pai cancelled every single one of these meetings.
“You have to have open networks — permissionless innovation. Period. End of discussion. They’re crucial to the future.” — Former FCC Chairman Tom Wheeler
Part 3: The War for Bits
“Sweet as One” by Craig and Karl. 2016. Candy.
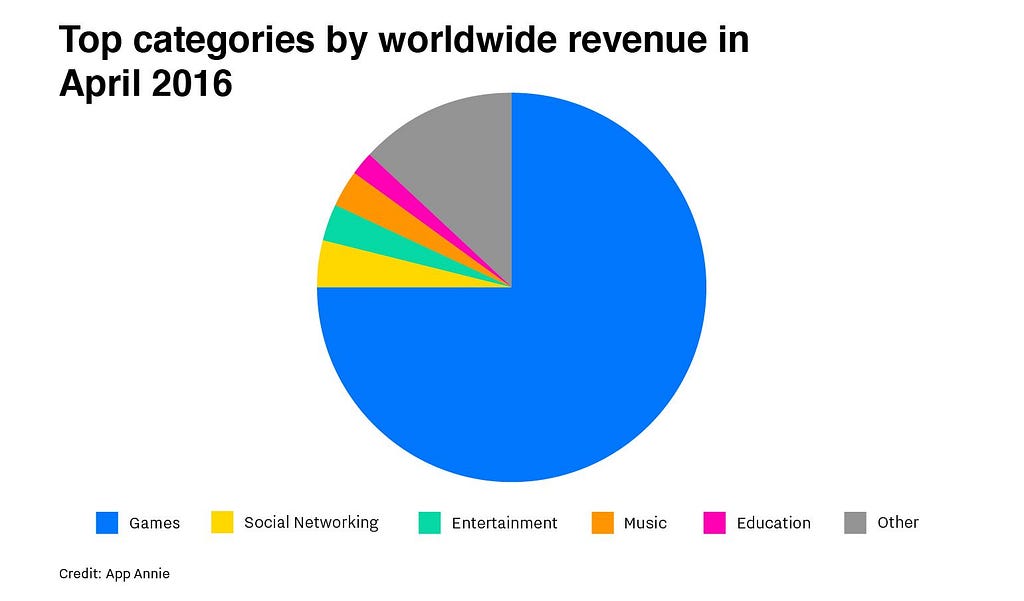
What does a post Net Neutrality internet look like? Look no further than the Apple App store.
There are two million apps in the app store, which shared a total of $28 billion in 2016. Apple takes a 30% commission on every sale, and made $8.4 billion from the app store alone.
Most of the remaining $20 billion goes to just a small handful of mobile gaming companies:
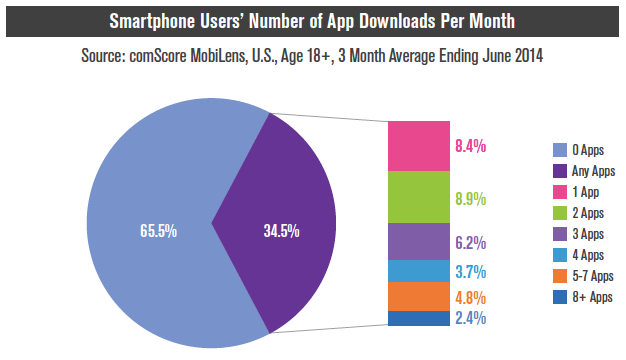
Most iPhone users download zero apps per month.
The minority who do bother to download new apps don’t end up downloading very many.
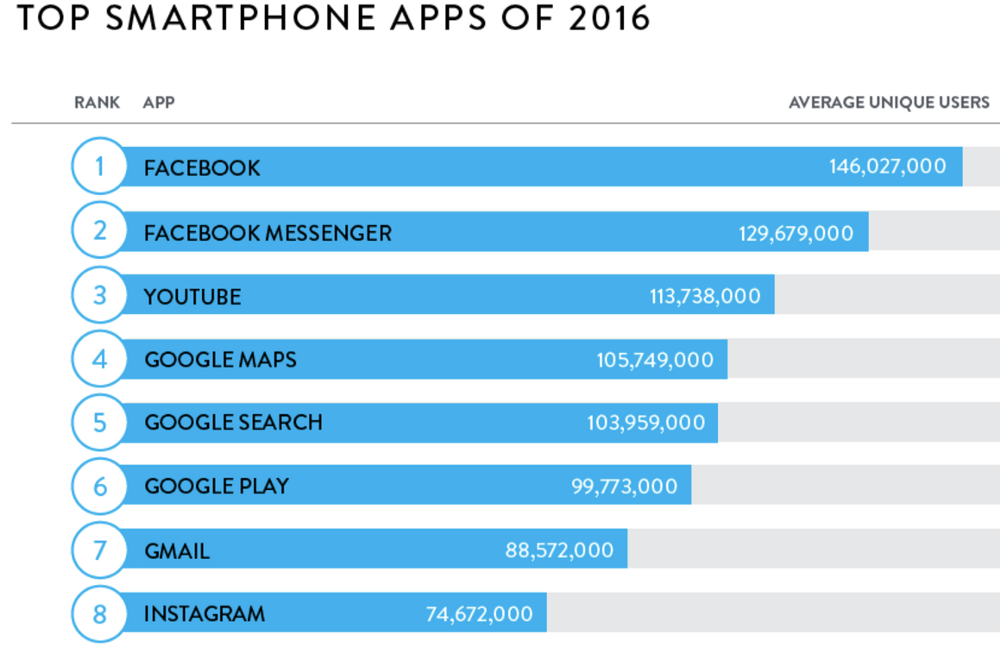
A vast majority of the remaining 2 million apps get very little traffic — and even less money.
The Apple App Store isn’t a level playing field. It doesn’t resemble the open internet it was built on top of. Instead, it’s an example of a walled garden.
Walled gardens look beautiful. They’re home to the most popular flora. But make no mistake, you won’t be able to venture very far in any one direction without encountering a wall.
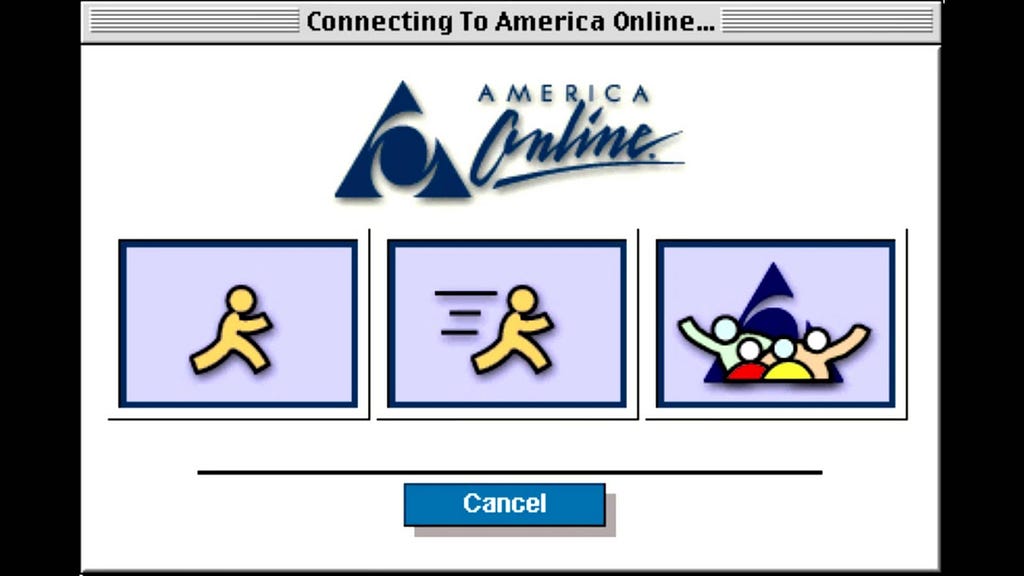
First there was the original walled garden of the internet, AOL.
20 years later, AOL still has 2 million users paying them $20/month. There’s a lot of money to be made in building walled gardens and trapping users in them.
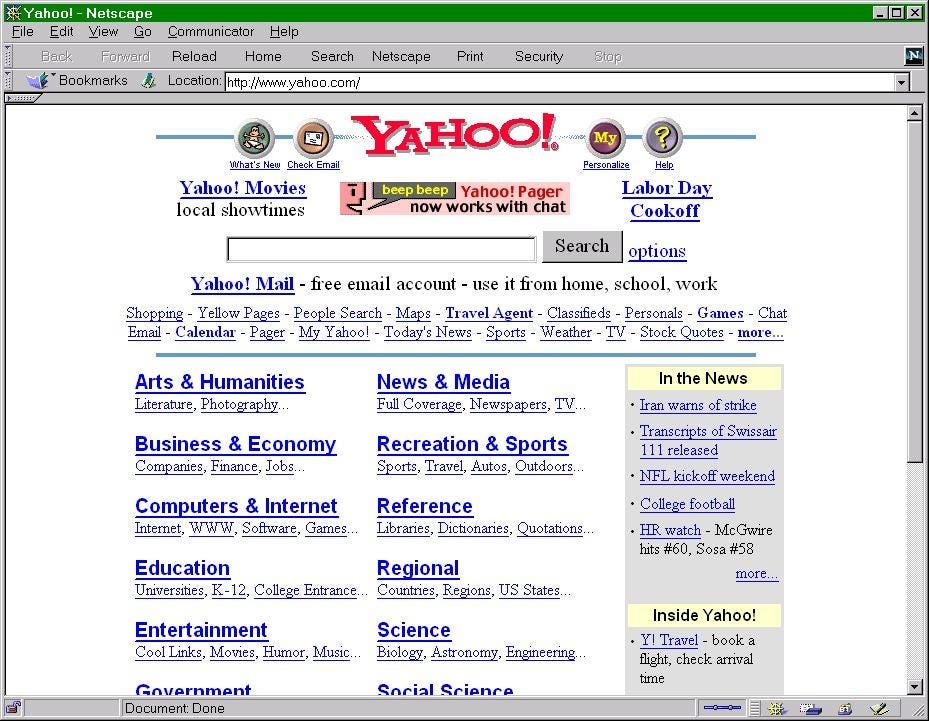
Then came Yahoo, which wasn’t a walled garden by design, but became one anyway because people were so new to the internet.
In the late 90s, startups raised money specifically so they could buy banner ads on Yahoo. It was the best way they could reach prospective users.
But Yahoo was a candle in the sun compared to the ultimate walled garden: Facebook.
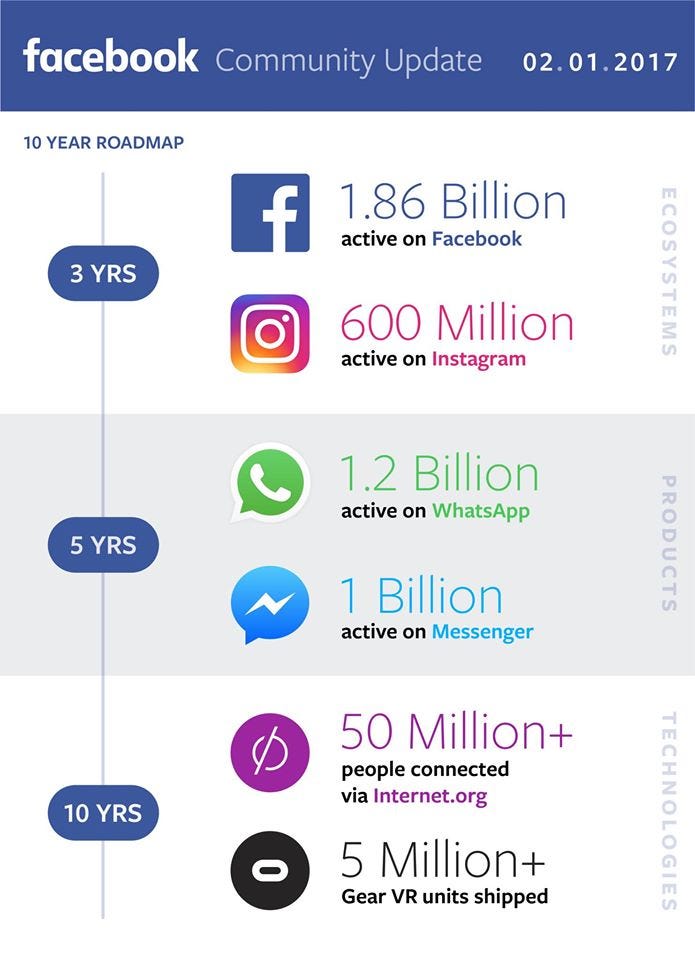
A quarter of the people on Earth use Facebook for an average of 50 minutes each day.
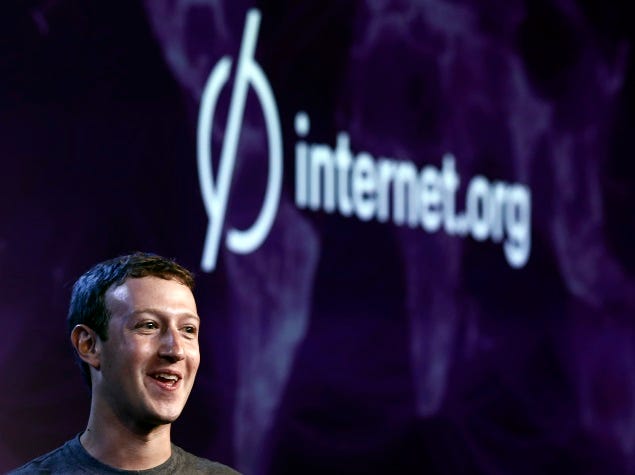
And those 50 million people connected to Internet.org that Mark Zuckerberg is bragging about? Those are people from extremely poor countries who were given a choice: they could either pay for the open internet or just get Facebook for free. They chose Facebook.
The insidiously-named Internet.org was famously rejected in India — among other countries — where activists were able to raise awareness about all the things Indians would give up by accepting Facebook instead of the open internet.
The zero in internet.org un-ironically stands for Zero Rating, an anti-Net Neutrality practice that’s illegal in most western countries.
Mark Zuckerberg may mean well, but he’s rapidly destroying the open internet. In his ravenous quest to expand Facebook’s market share, he’s even gone so far as to build a sophisticated censorship tool so that Facebook can appease the governments of countries where it’s currently blocked, like China.
And Facebook is just one of several internet corporations who stand to profit from these sort of closed-source, closed-data walled garden platforms.
So what makes you think they won’t come to control the very internet they dominate?
Even as the costs of launching a website fall, the costs of reaching an audience continue to rise.
Facebook and Google account for 85% of all new dollars spent on online advertising. Everyone else — newspapers, blogs, video networks — is fighting for crumbs — the 15% that fell from Facebook’s and Google’s mouths.
Half of all internet traffic now comes from just 30 websites. The remaining half is thinly spread across the 60 trillion unique webpages currently indexed by Google.
If you’re familiar with the concept of a long tail distribution, you’ll recognize this phenomenon as an extremely fat head with an extremely long, skinny tail.
We blindly trust tech founders to be benevolent
You may think that the Mark Zuckerbergs and the Larry Pages of the world would know better than to abuse their power. But such scandals have happened in the past.
Reddit is one of the most popular websites on the internet. One of its founders recently put the company’s reputation in jeopardy when it was discovered that he’d been going in and modifying users’ comments in the database — essentially putting words in the mouths of people who were critical of him.
We are not only placing faith in the temperament of the elite handful of tech company founders. We’re also trusting that other actors — who ultimately take over these organizations — will be benevolent. Even when we know that their shareholders — or governments — can force them to be malevolent and do things that go against their users’ interests.
However you may feel about Mark Zuckerberg and his intentions, know this: Just like the “benevolent monopolist” Theodore Vale, who championed rural access to AT&T in the early 20th century, Mark Zuckerberg will one day retire. And the person who takes over Facebook will not be nearly as forward thinking as he is. Most likely, it will be some finance guy or sales guy (think Steve Ballmer) who will sell Facebook users — and their Exabytes of data — down the river.
In the future, our internet could become as locked-down as China’s
China has the most sophisticated censorship tools in the world. So much so that other authoritarian regimes license the use of these tools to control their own populations.
1.4 billion Chinese people are locked down in a closed internet, behind the Great Firewall of China.
The anti-Net Neutrality agenda that the ISPs are pursuing would require them to use a technique called Deep Packet Inspection. Without looking inside the contents of every packet, it is impossible for ISPs to decide which packets they want to selectively slow down.
This means that in addition to sending packets of data through their networks, ISPs would actually have to look inside each of these packets — and would quite likely record the contents of these packets. It would be expensive, but storing major chunks of the Zettabyte of information the internet generates each year is within the budgets of large corporations and governments.
Monitoring internet traffic at this level of detail would make pervasive censorship possible. This is one of the techniques China uses to re-write its history. And it works. Despite the advances in information technology, to this day many Chinese still don’t know that the Tiananmen Massacre happened. And when they do learn of it, it’s ancient history — sapped of most of its perceived relevance.
“Ideas are more powerful than guns. We would not let our enemies have guns, why should we let them have ideas.” — Joseph Stalin
If the ISPs succeed and the open internet falls, corporations and governments would have a mandate to censor the most powerful communication tool in human history — the internet — in its entirety.
Part 4: Who controls the information? Who controls the future?
“Ascension” by Nathan Sawaya. 2014. Legos.
Whether these corporations are aggregating power through regulatory capture or by amassing exabytes of your data, they are steadily becoming more powerful. They are using their growing cashflow to buy up competitors.
This isn’t capitalism — it’s corporatism. Capitalism is messy. It’s wasteful. But it’s much healthier in the long run for society as a whole than central planning and government trying to pick the winners.
Capitalism allows for small businesses to enter and actually stand a chance. Corporatism makes it impossible.
If you’ve read this far, I hope you understand the gravity of this situation. This is not speculative. This is really happening. There are historical precedents. There are present-day examples.
If you do nothing, we will lose the war for the open internet. The greatest tool for communication and creativity in human history will fall into the hands of a few powerful corporations and governments.
Without your actions, corporations will continue to lock down the internet in ways that benefit them — not the public.
The most urgent task at hand is stopping FCC Chairman Ajit Pai from disassembling Net Neutrality.
Help us fight this war. Here’s what I’m asking you to do:
Share this article with your friends and family. I realize the irony of asking you to use walled gardens to reach your friends and family, but this late in the war, these are the best tools possible. Share this article on Facebook or tweet this article.
Only we, the public, can end The Cycle of closed systems. Only we can save the open internet.
Thank you for reading this, and for caring about the fate of our open internet.
Raspberry Pi just turned 5. Here’s a brief history of the world’s tiniest hobbyist computer. (5 minute read)
A chatbot that overturned 160,000 parking fines is now helping refugees claim asylum (3 minute read)
Thought of the day:
“History shows a typical progression of information technologies, from somebody’s hobby to somebody’s industry; from jury-rigged contraption to slick production marvel; from a freely accessible channel to one strictly controlled by a single corporation or cartel — from open to closed system.” — Tim Wu
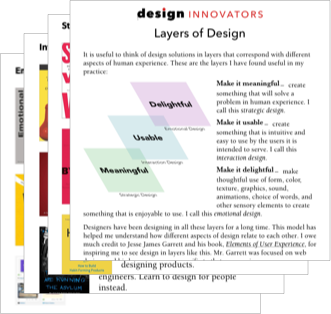
In some reaches of the product development world there is a fascination with the idea that products can nearly design themselves through an iterative process of development, testing, and incremental improvement. This is what I call “design Darwinsm.” Design Darwinism often enters the product development conversation as an extension of a Lean, Agile, data-driven, or A/B testing framework.
The prospect of great products arising out of a primordial soup of nebulous product ideas and gradually evolving into great products without the need of designers is a stirring notion for some. The problem is, it doesn’t work. You can’t design by iteration and incremental improvement. There is no such thing as design Darwinism in the real world (except that which brings about the extinction of poorly-designed products).
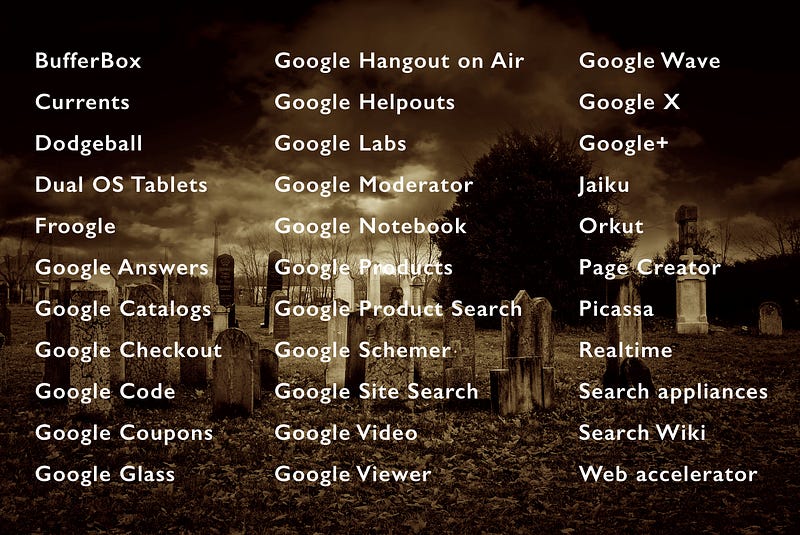
Google: the grand experiment in design Darwinism
Google has famously rolled out dozens of “beta” releases, apparently hoping that iteration would turn them into great products. This massive, expensive, and ongoing experiment with the engineer-and-iterate approach to product development has not led to a portfolio of great products, but to a graveyard of failed ones. Remember these?
I believe these products failed because Google thinks great design can be achieved through iteration. Google (now Alphabet) could be regarded as the world’s greatest laboratory for design Darwinism with its tremendous resources and its engineering-led product management processes. But can you name any great, innovative product that has emerged from its iterative processes?
Yes, Google is extremely successful, and I give them full credit in “Google’s greatest design triumph.” But don’t forget (or maybe this is news): Alphabet makes almost all of its profits selling ads and loses billions on its other projects. Yes, ouch. Google can afford to lose billions experimenting with design Darwinism, but you, more than likely, cannot.
But wait, don’t design thinkers preach iteration?
Yes! Iteration is a great design tool. Design processes can benefit enormously from putting a concept, prototype, beta, or early version of a product in the hands of users, obtaining feedback, and adjusting the product to improve the user experience. This kind of feedback loop is helpful at every stage of the design process. But…
To mistake the design tool of iteration for design itself is a grave error.
Here are three reasons why:
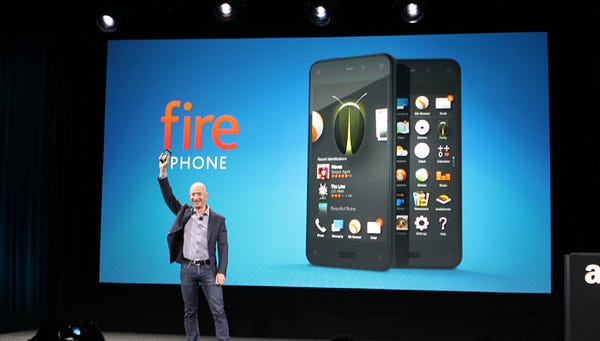
1. Iteration cannot innovate
Iteration is by nature not innovative; rather, it is aimed at incremental improvement. It is not useful for discovering an unmet user need that can lead to a great product. That is what strategic design is for.
Jeff Bezos had this idea for an Amazon phone, the Fire Phone. It was fully 3-D enabled—very exciting. But consumers could not see how it would improve their lives enough to switch from their iPhones or Android phones. So the Fire Phone was dead on arrival when it was launched on July 25, 2014. According to a report by Fast Company, Bezos said six months later, “it’s going to take many iterations”…and…“some number of years to get it right.” That was over two years ago. How are those iterations going, Jeff? Real innovation comes out of great design from the get-go. If strategic design is missing from a product—that is, if users do not find the product meaningful to them—no number of iterations can save it.
2. Iteration can find usability problems, but it can’t solve them
The use of iteration and user feedback is especially good at identifying usability problems. Jakob Nielsen wrote a classic article on this subject. But the kind of feedback obtained in this kind of iteration cycle mainly helps to discover problems with a current design. It does not tell you how to solve those problems. Users are very good at letting you know by their actual behavior if they do not know how to use a feature of your product. But they are notoriously bad at being able to tell you how to fix your product. That is why some good folks spend their careers learning interaction design in depth and becoming experts at solving usability problems and creating products that feel simple and intuitive.
Iteration with user feedback is great for identifying problems with your design. It doesn’t do a thing to tell you how to fix those problems.
3. Iteration cannot create delight
I use emotional design to refer to those aspects of product design that help create an emotional connection with the user: form, color, graphics, images, textures, sounds, animations, typography, the wording of text, and so on. Designers who are experts in these areas can take a product that is already meaningful and easy to use and make it a delightful experience for users. The ability to create delight in these kinds of details is a special skill that cannot be replicated through iteration and testing. Yes, you can do A/B testing to find out if users are more likely to click on a blue or an orange button, but no amount of A/B testing is going to create a delightful product.
So…dispense with dangerous delusions of design Darwinism
As tempting as it may be to believe that products can virtually design themselves using a nifty engineering-led, Darwinistic process, such beliefs are misplaced and will not lead to the creation of great products. Rather, product managers need to:
Establish the soul, the meaning, the why of a product early on, using thoughtful strategic design.
Make the product usable through the skillful application of interaction design.
Make the product delightful through the handiwork of experts in various aspects of emotional design.
Design like a pro, as described above. You will dodge the debacle of design Darwinism and be on your way to creating great products!
And to help you design like a pro, click here to get a free “layers of design” list of top inspirational resources on strategic design, interaction design, and emotional design.
from Sidebar http://sidebar.io/out?url=https%3A%2F%2Fmedium.com%2Fthe-design-innovator%2Fiteration-is-not-design-668695445f76


 https://techcrunch.com/2017/03/22/apple-has-acquired-workflow-a-powerful-automation-tool-for-ipad-and-iphone/