Tobias Frere-Jones: Break Things Deliberately

As one of the world’s leading typeface designers, and this year’s 99U Alva Award winner, Tobias Frere-Jones believes that the best way to learn a new skill is to “break things down deliberately” to understand how it’s really done.   

In this talk, we learn to see the beauty in taking risks. Frere-Jones explains that in order to do our best creative work, we must not just permit moments of confusion, but actually go chase them. “When trying to figure out a problem, pause for minute, and see if you can make it worse,” he says. “A structure can really describe itself as it falls apart.”

Over the past 25 years, Tobias Frere-Jones has created some of the most widely-used typefaces, including Interstate, Poynter Oldstyle, Whitney, Gotham, Surveyor, Tungsten, and Retina.

Tobias received a BFA in Graphic Design from the Rhode Island School of Design in 1992. He joined the faculty of the Yale University School of Art in 1996 and has lectured throughout the United States, Europe, and Australia. His work is in the permanent collections of the Victoria & Albert Museum in London and the Museum of Modern Art in New York. In 2006, The Royal Academy of Visual Arts in The Hague awarded him the Gerrit Noordzij Prijs for his contributions to typographic design, writing, and education. In 2013 he received the AIGA Medal in recognition of exceptional achievements in the field of design.

As a typeface designer, I get a lot of questions about– about the work that I do. When I describe what– what I do for a living, this can be one of the responses. [LAUGHTER] And taken a little further, you’ll get to the– sort of the classic question that typefaces– that every typeface designer gets, which is why make more typefaces? Aren’t there enough already? And I used to hate this question, because it always sounded like someone saying to me, like, you exist? But what’s up with that? [LAUGHTER] But– but I actually welcome this question now, because it’s an opportunity to explain what I do and advocate for its value. And I think it’s also– I think it’s also a powerful thing to present the mission statement of your career, as we say it out loud, in your own voice, to hear yourself saying that. It sort of helps keep you grounded that way.

But as I think of it, typeface design stands at this curious intersection of culture, and language, and technology. And any one of these can present a new problem or a new challenge. But certainly, when they start combining with each other, then there will be new problems to confront with culture, and technology, or technology and language. These can turn into problems to solve.

So while typeface designs can be artistic expressions, and they can be cultural artifacts, if they are fully realized and properly executed, they’ll be the solution to a problem. That’s how I think of it. And I think that’s– that makes it more interesting, I think. Also, it makes it more difficult, but thankfully, I have an affection for things that are difficult. So typefaces are solutions. And we need them, because we keep having new problems. So that’s how I’ve come to– come to think about it. How I’ve– that’s my answer for that– that perennial question. So it means that I spend– I spend a lot of time thinking about where I’ll find these answers for whatever challenge is at hand, and then figure out how to turn that answer into Serifs and Excites, and Bolds, and the rest of all that. So to– so to understand the– sort of the way I go about this, I’ll have to go back to my sort of previous life as a painter.

This is what I used to do before I was– I was a typeface designer. And in the way that I approached painting, questions and answers exist independently of each other. They don’t rely on one another. It’s possible to find an answer before you actually know what the question is. And in the kind of painting that I did, there was no explicit problem to solve. There just was sort of the generalized challenge of creating an atmosphere, or taking some state of mind and– and making that visible. But that idea of finding the answers before you know what the questions are, I’ve always– it’s something that I found really valuable, and something that I’ve kept with me, as I moved into type design, and it’s– it’s implication is that you have to collect everything– ideas, objects, anecdotes– and trust that these things will be useful at some point, if not today, then perhaps tomorrow. It also means that you will probably end up with a storage space full of junk. [LAUGHTER] Actually, I have two, come to think of it. But you become a kind of pack rat. And I don’t know. That’s– that’s– you’ll see how this– what this turns into.

While I was at college, I had decided that type design was the field that I would go into, but discovered that there was no organized instruction in this particular field. So I had to– it was up to me to work this out for myself. And the process of reading is a really complicated one, if you think about this for a moment. If I– I can make a set of marks and declare that each one of these has some phonetic value, then pass them on to someone else who will organize them into some sequence, these things will get passed onto someone else who will unpack these forms, hopefully agree with the declaration that I’ve made, and receive the content of some third party, hopefully, without any kind of distortion along the way. This is a really complicated process. And I thought that if I aspire to shape some part of this process, I really ought to know how each part of this– this string, this contraption, works.

So how I am I going to do that if I’m not really getting any help and I’m on my own here? So I devised a sort of plan for self education. It’s something I sort of instinctively done for years. And in this case, my plan centered on breaking stuff. I was absolutely the kid who would take the– the radio, or the alarm clock, and take it apart and see how it works. I liked to have the batteries in and the whole thing turned on while I was doing it, so that I could find out when the radio would go silent, when I pulled out this wire, or undid this bolt, because that’s how I would learn something. That’s where sort of the real lesson would come from. And I’ve always thought that there is something really informative in watching something break or collapse, that a structure can be– can describe itself really eloquently as it falls apart.

So if I wanted to learn about reading, what would happen if I tried breaking this process in some way?

So on my own I created a series of typefaces that had the explicit aim of throwing wrenches into the works of the process of reading, very deliberately and with a specific target to see how exactly things would screw up. One would focus on taking some central assumption about how text is meant to work, like one letter ends before the next one begins. What happens if that’s not the case? What happens if you pull that bolt out? Will things keep working? Another focused on the idea of ingredients and recipe. So what would happen if you had all of the things that you need to recognize these letters accurately, but then did a little bit of rearrangement? What would happen?

As it turns out, it kind of messes with your head, at least it messed with my head. But there is one experiment that began when a couple friends of mine mailed me a flyer that– that someone had handed them on the street. This is not it. It’s– it’s lost, or it’s buried in some storage space somewhere. But it looked roughly like this. And they sent it to me with this sort of joking dare to try to make a typeface out of this– this blobby mess of a thing. And I actually took it seriously, because I saw on this a really great way to break the alphabet. This is one I hadn’t thought of before. So I made a typeface called Chain Letter out of this– this photocopied flyer that had been copied over and over again. And what I– I thought it was fascinating is at the shapes had become so distorted, that the very identity of them were starting to fade as well. So this is the Aegean Sea, cap G and cap C.

But there’s barely a line between these two shapes now, because so many things have decayed and fallen away. There is a tiny bit of a hint of a crossbar, or I should say, a tiny hint of something, which might be interpreted as a crossbar, in which case you can conclude that this says hi. Or you could skip over that and conclude this is the Roman numeral three. What would happen with that kind of ambiguity? Would our experience as readers be able to step in and figure out, that this is an m with a whole in it, or that these are just two shapes that have nothing to do with each other? Later I took this idea a little bit further and started making some– some pen and ink sketches, in this deliberately sort of sprawling, sloppy style, being deliberately vague about the letters that I was drawing. And the– the endpoint for this was this typeface called Sum of the Parts. And the challenge here, or the goal here, sometimes I’m tempted to call it the sort of the punchline, is that there appear to be 26 letters here. But they’re actually only 11. And each one serves to represent at least two, sometimes three other letters of the alphabet.

So– and the question here would be what– how much could context and experience– how much slack could those pull up if the individuality of each letter has been completely shut down?

And it turns out– they can pull up some of the slack, not completely, but it’s still an important lesson to– to think about. But throughout all this, I was just collecting answers, just wagering that at some point in the future I would find some question that looked sort of like this, and be able to apply it. So even the ones that– the experiments that– that blew up, became completely illegible, like this one. They were informative in their own particular way. The lesson here is don’t do this. [LAUGHTER] It doesn’t work. But it was still valuable. I wasn’t getting paid. I wasn’t– I was out of school by this point. I wasn’t getting college credit for any of this stuff. But this still– you know– I was still acting like a pack rat, collecting all the stuff and saving it somewhere.

So if we fast forward several years, and I’m all grown up, or at least I present reasonably well as a grown up, and I’ve got clients. “The Wall Street Journal” was getting redesigned, top to bottom. And with their external consultants, they decided that the stock listings section of the newspaper needed to be redone. The whole thing needed to be pulled apart and put back together again. And they needed a new typeface for their stock listings. Now the newspapers are a hostile environment for typography, for all kinds of– for physical reasons and operational reasons. Because the paper is cheap. The ink tends to be kind of thin. The press is moving really fast. Space is literally at a premium. So everything is working against clarity and beauty. But on the stock page, I realized that it actually gets even worse, because the content there isn’t even language. [LAUGHTER] This is what the stock– this is the kind of stuff you’ll find on a stock page. And normally, if you’re reading a story anywhere else in the paper, and one letter is a bit vague, so a bit of ink smear, your experience as a reader can fill that in, and sort of your experience and can step in as a judge and resolve the ambiguity. That’s not going to work here. Because any sequence of letters and numbers, cap and lowercase, any of this isn’t going to look plausible. So your experience is not really going to help you out here.

So I thought that something kind of radical was needed in the face of such a tall order. And at this point, I remembered a– an anecdote, one of these things I had collected and stored away somewhere. And it was about– it was about a filmmaker from years past. And in his class, at whatever university it was, he liked to show his students really lousy films as well as really good ones. And the idea, as I understood it, was that if you just look at really good work, you’ll learn how to make good films, but only in the way that that person had done it. If you look at work– at work that’s crap, and talk about how it went wrong, and what else could have been done, you get the same kind of knowledge, but without that sort of built in preference. You get the insight without the bias. And I thought it was a really fascinating idea. It stuck in my head for a really long time. I believe the filmmaker was Fritz Lang, though I was– I haven’t been able to confirm that. It’s possible I’m getting that wrong. It’s also possible that I just made the entire thing up. But either way, it– this seemed like an idea worth remembering and considering. This came to mind again while I was thinking about what “The Wall Street Journal” needed, and this very severe problem they had, and realized that in this– this idea of what I was thinking of as the inverted negative, I already had half of this work done from way back when in my, you know, just barely out of adolescent years, when I’d stay up late at night figuring out ways to break the alphabet. I had a kind of reverse blueprint of how to take on this really serious problem of legibility and environment.

So what would happen if I took those old experiments, like Chain Letter, and Sum of the Parts, and turn them upside down, and did the exact opposite of what I did there? What would happen? So what I came out with in this design, that ended up being called Retina, I created a strategy where every– I identify in every letter a feature that happens there and nowhere else. And so in the case of the capital B, I decided that was the triangular white space on the right exterior where the two curves meet. So that part of– of the shape, is blown up as big as possible, and the rest of the letter just follows along however it needs to. And following on– on the sort of the Sum of the Parts model and turning it upside down, where there are shapes that had a kind of structural sympathy with one another, they were pushed as far away from each other as possible. So the profile of the E is sort of vertical as I can get it. And the profile of the F is diagonal as possible. All this had to– had to get added up with these big chunky notches taken out of intersections, to accommodate and sort of to anticipate, the ink spread that would happen on press. So– so this is what– what this turned into in the end, a much larger family, but this is one– the sort of core of what Retina looks like. This is one of the most satisfying projects I’ve ever done. I meant to say that before. But one of the really fun parts of this was subjecting these forms to various forms of duress.

Trying to break this, and seeing what happens, and putting it side by side with Helvetica Light Condensed, which is what the “Journal” had been using before, and trying to see what would happen if someone’s vision were not quite up to– you know– were not quite 20/20, which as it turns out, is actually the prime readership of the stock page– [LAUGHTER] –of the Journal. Because the people who were doing this professionally are getting their quotes online. The only people who are getting their stock prices out of the paper are retirees. So it actually got worse. But it was amazing to see how fragile Helvetica can be. I will resist the temptation to go off on this rant about Helvetica. It does not deserve the reputation that it has, whatever. I’m not going there. Don’t worry about it. [LAUGHTER]

But a– a large part of– or this– potential for confusion between shapes was particularly urgent with the numbers. Because this forms a– you know– something like half of the content of a stock page, and there were four numbers in Helvetica. And the 3, the 6, the 8 and the 9 that are just one smudge away from being mistaken for one another. And again, we’re not going to be able to rely on our experience in our content to figure out that something’s wrong. So the numbers in the Retina push all these shapes as far away from each other as possible, so that they are as durable as possible, and as immovable as– if I could ever make them that way. So in the end, the paper was able to get 11% more text on the page. And I did the math about the– you know– how much paper “The Wall Street Journal” was saving, and you know, how many issues in a day, how many copies in a year, and how many trees that added up to. And I felt pretty great about myself, but then discovered that the paper was using that opportunity to just sell more ad space. [LAUGHTER] So I don’t know. I did my part. But– but the best part– the best comment about this design came out of one of the focus groups, where a retired stockbroker, someone who’s 80 years old, looked at this new format for the paper and said, I don’t know what you did, but I don’t need my glasses anymore to read the prices in the paper. It was one of the best things I’ve ever heard about anything I’ve ever done. But the– so the theme through all of this– that we’ve been talking about– is self- education. And it’s always been an important part of my life whether I’ve realized it or not.

And if I have any advice to offer, it’s to not just– you know– permit these moments of disorientation, or confusion. But actually go chase them. If you’re trying to figure out how to solve a problem, pause for a moment and think about how you can make it worse. Try to break this thing. And then walk into that tremendous mess that you’ve made, and with all of your senses on, all of your imagination turned up. Because you can find something pretty amazing in all that mess, in all that wreckage.

Thank you.

from 99U99U http://99u.com/videos/53989/tobias-frere-jones-break-things-deliberately/

Using Card Sorting to Create Stronger Information Architectures

By Jitesh Jaidev Jumani

Card sorting is an information-architecture technique that enables a group of subject-matter experts or users to either

  • provide input to the definition of a new information architecture for a Web site or application
  • evaluate and provide feedback on a Web site’s or application’s existing information architecture

During a typical card-sorting exercise, participants organize a set of cards comprising navigation items for a particular context into categories or groups that seem logical to them. Participants can name these groups and, thus, create a folksonomy, or user-defined taxonomy. Read More

from UXmatters http://www.uxmatters.com/mt/archives/2017/01/using-card-sorting-to-create-stronger-information-architectures.php

How Blockchain is overshadowing Bitcoin

Steve Jobs once said that “the ones who are crazy enough to think they can change the world are the ones who do”. That’s the motto an anonymous person* took to heart as he shook up the financial world by creating an unregulated tech-based currency in early 2009. That very currency was developed using another revolutionary technology which is now in the news for its uses beyond trading unregulated online money, and has become a hot topic amongst financial and business executives recently.

Let’s discuss what both technologies offer their users, and what the future holds for each.

Bitcoin’s introduction

“This event was off the charts”

Gary Vaynerchuk was so impressed with TNW Conference 2016 he paused mid-talk to applaud us.

Bitcoin is a cryptocurrency, created and held electronically on your PC or in a virtual wallet. No one controls it or sees it – it’s decentralized so no person, institution or bank controls the currency.

It was the year 2009 when bitcoin burst onto the financial scene, and soon computers all over the world started running sophisticated programs that would mine blocks of bitcoins by solving extremely complex mathematical equations. Mining bitcoin means to discover or verify new bitcoins because unlike traditional currency, bitcoin cannot be printed. Miners make money every time they discover new bitcoins or verify a bitcoin transaction.

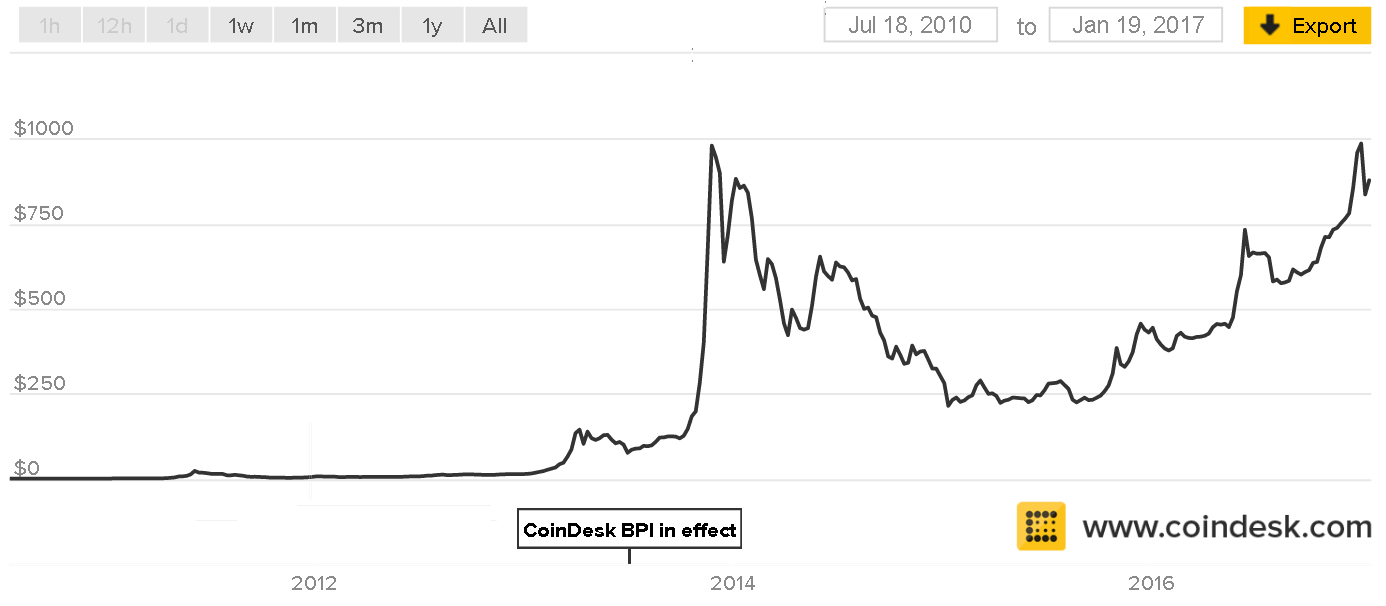
There can only be a fixed 21 million bitcoins [to prevent inflation], out of which 15.5 million are currently in circulation, which leaves 5.5 million bitcoins to be discovered. These valued blocks of online information skyrocketed in price as time went on and investor appeal in the new technology grew. Today, January 19th, bitcoin is showing an upwards trend and is trading at US $890.90, below the US $1000 threshold it broke in November 2013.

Figure 1 Bitcoin price between July 2010 and Jan 2017. Source: Coindesk

Trading could be done online – anonymously, quickly, without hassle from regulatory and exchange bodies. The ease of use and lack of a trail led to flexibility unheard of in the financial world. But for all its benefits, the currency was overshadowed because of its anonymous, unregulated nature as it became easy for people to use the currency for illicit transactions that would stay off the books, as well as for schemes that swindled people.

Coinbase has been one of the biggest proponents and enablers of bitcoin use. In an era where most traditional financial institutions avoid bitcoin discussions, the company sticks vehemently to its stand on bitcoin, likening the resistance of business executives to bitcoin to how companies once preferred private intranets over the open internet. We all know who won that battle!

The Blockchain

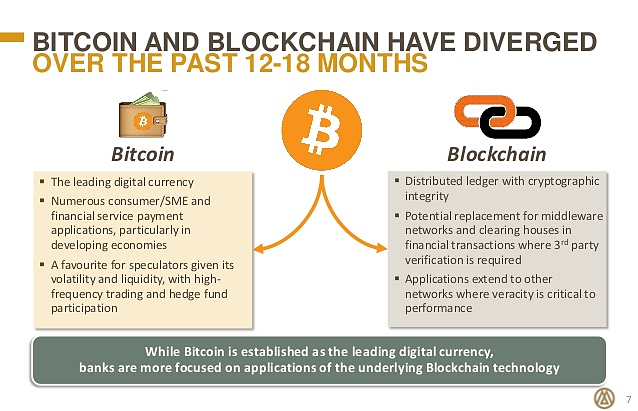
While bitcoin had the power to make transactions untraceable, it was another innovation that promised to make every transaction transparent and permanent. Underlying the use of bitcoin is blockchain, which is almost entirely opposite its more famous alter-ego. Blockchain possesses the ability of having permanent records of the transactions the blocks (the name for their portions of value) are used for, and at any time people can see those changes online in real time. It is this transparency that people have hopes in, but that’s not the only thing blockchain does differently than the cryptocurrency it drove for so long.

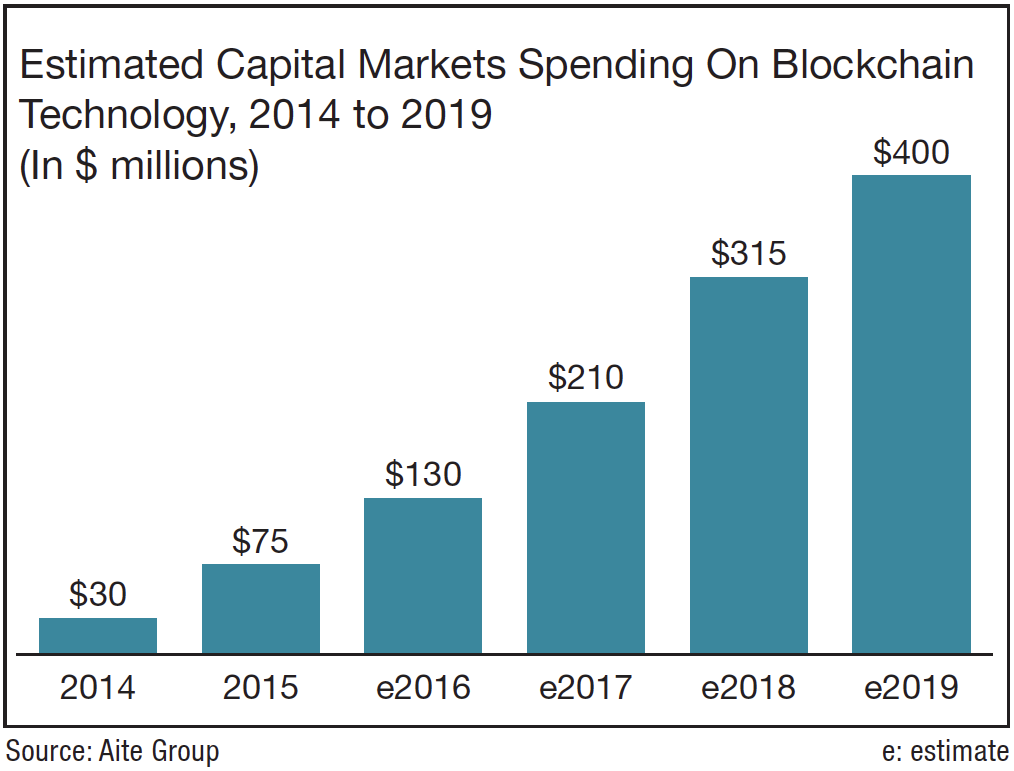
Blockchain can easily transfer everything from property rights to stocks and currencies without having to go through a middle man and clearing institution like SWIFT, while offering the same safety, higher speed and lower costs. Consider it from the financial perspective: billions of dollars are transferred daily in the financial markets, with every transaction being “cleared” by a middle man. Replacing the middle man with a revolutionary technology that is faster, cheaper and as secure will help save millions for businesses.

To put into perspective just how big the market is now and how big it will become, the World Economic Forum shared some metrics on Bitcoin and Blockchain. It estimates that currently $20 billion dollars’ worth of Bitcoin exists now on record. The bigger prediction, though, was that by 2027 about 10 percent of the entire global GDP would be stored on blockchains, meaning anyone who wanted to become part of that process still has time to get a piece of the pie.

Banking allies

Because of its “cleaner” reputation than bitcoin, blockchain has garnered the support of different financial institutions behind its design. Goldman Sachs, JP Morgan, and Bank of America have expressed great interest in blockchain by joining a coalition to implement it into banking practices. In addition to those large financial players, Visa, NASDAQ, Citi, and others have also agreed to be clients for blockchain related services and technology. These large, long established institutions feel that blockchain has less of a negative image attached to it than bitcoin, and because of that they seem more open to trying out the technology.

The rush towards blockchain is simple: banks can increase the efficiency of their transactions by using their own permissioned blockchains to record all transactions done by their customers, as opposed to trying to record all that data with different types of software that become outdated every few years.

However, some experts like Don Tapscott [University of Toronto] think that banks should be using blockchain technology not just to increase their banking capabilities, but to completely change how banking computing looks like for the entire industry.

Indeed, outside of traditional banking, blockchain services have allowed users to engage in high value currency transactions already. The processing times on these transactions are very quick, and allow for a high volume of money to be exchanged and recorded.

Bitcoin startups and their evolving strategies

Major bitcoin players include names such as Bitreserve and Circle.

Bitreserve serves as an online portal to convert currency from one form to another. In the beginning, users had to deposit their currency in bitcoin form, and could then convert their bitcoin into 25 other world currencies or four different types of valuable metals. Circle at first only allowed use of its transfer services – amazingly quick money transfers to anyone, anywhere – to be done in bitcoin money, including the process of depositing, holding, and sending of currency.

Many of the companies who started off using bitcoin as their main currency are changing to focus on blockchain as a whole. Bitreserve changed its name to Uphold and has since allowed depositing of currency in any form, and Circle has changed to allow use of credit and debit cards to be used for deposit, holding, and sending of money worldwide.

Many startups that were created with a focus on bitcoin are changing to accommodate alternative currencies and to let others know that they are not nearly as bitcoin dependent as before for what seems to be a similar reason to the one banks use: that bitcoin has a negative connotation to it, and since blockchain is the hot commodity now, it seems like a smarter idea to tie the business to that. They hope that, as more businesses and users adopt the blockchain technology, their use of it will also allow them to gain in popularity and use.

What it means for businesses

For players in the financial sector, the best thing to do right now would be to seriously consider the advantages of blockchain. While bitcoin is the most top of mind for the general public, blockchain is attracting the biggest forces in the finance sector with its clean reputation. More than that, blockchain offers the opportunity to revitalize modern value transactions as we know it, and those who get their stakes in before that happens will have the best chance to shape what happens after. It’s business management 101: first-mover advantage!

Is it crazy to change course of your company to try something so new, something so different from what you have has been accustomed to. Maybe so. But as Steve Jobs very rightly noted when thinking about changing the world, financial or otherwise – it’s usually the crazy ones who do.

from The Next Web http://thenextweb.com/business/2017/01/23/blockchain-overshadowing-bitcoin/

Kroger Tests Sensors, Analytics In Interactive Grocery Shelves

Kroger Co., the largest supermarket chain in the U.S., is testing sensors and analytics technology to let shelves and products interact with shoppers walking the grocery aisles. The system, which detects individual shoppers through their mobile devices, can offer tailored pricing on specific items and, through 4-inch color display screens, highlight products on the customer’s […]

from CIO Journal. http://blogs.wsj.com/cio/2017/01/20/kroger-tests-sensors-analytics-in-interactive-grocery-shelves/?mod=WSJBlog

The Internet, Blockchain, and the Evolution of Foundational Innovations

Last year, a panel of global experts convened by the World Economic Forum selected blockchain as one of the Top Ten Emerging Technologies for 2016, based on its potential to fundamentally change the way economies work. But, how transformative will blockchain turn out to be? How long is the transformation likely to take? And how […]

from CIO Journal. http://blogs.wsj.com/cio/2017/01/20/the-internet-blockchain-and-the-evolution-of-foundational-innovations/?mod=WSJBlog

Storyframing: What we want users to do

By Steve McCarthy

In September 2016 I posted an article on a new method for defining user stories and journeys called Storyframing. More specifically it was a method for…

Designing a digital service or product around distinct user behaviour, helping to ensure user adoption and repeat use are front of mind from the outset of a project.

The process was born out of a frustration for not having a readily available framework that considered behaviour change or long term user engagement in detail.

Feedback from the UX community was positive and some of the readers suggested that I share more information on the Storyframing method…

An idea…

Not everyone gets to see their favourite bands in concert.

Obstacles like ticket costs, age limits, and location can make it difficult for fans to experience live music.

But what if we could transport customers to the front of the stage using VR? What if the number of tickets a band could sell wasn’t constrained by the capacity of a stadium?

VirtualPass (a fictional company) is a startup who have had that very idea. They now want to better understand how their service is best placed to create compelling stories for their potential customers.

Time to start storyframing…

1. Categorise your users

VirtualPass* have two core user personas they want to target:

i. Young at Heart — New Users

ii. Connection Fan — Returning Users

2. Define your moment ingredients

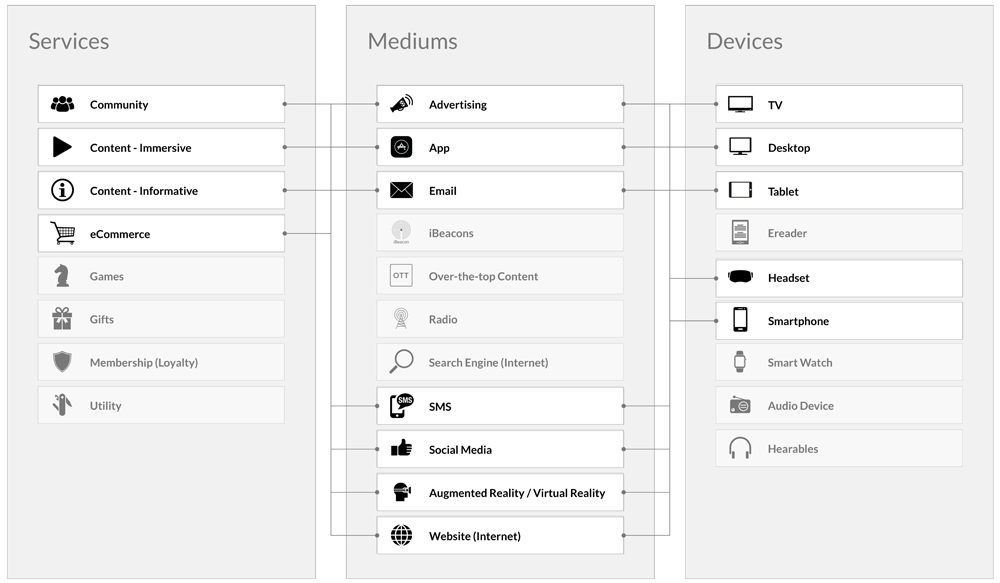
Following a stakeholder workshop with the brand we identified the following as viable Services (S), Mediums (M), and Devices (D) at their disposal:

Offline Ingredients
Online Ingredients

3. Understand moment types

This is an easy step. We’ve storyframed before so we know that there are 4 types of Moments (m):

  • Trigger (Tm) moments
  • Action (Am) moments
  • Reward (Rm) moments
  • Investment (Im) moments

We just need to keep this in mind for when we start to craft our stories.

4. Set behaviour goals

By returning to the brand’s pre-existing persona work we can draw from actual user sentiment in order to identify their behaviour goals. If the brand hadn’t conducted this type of research then this is something we would recommend before continuing. Otherwise we risk designing a product that nobody wants.

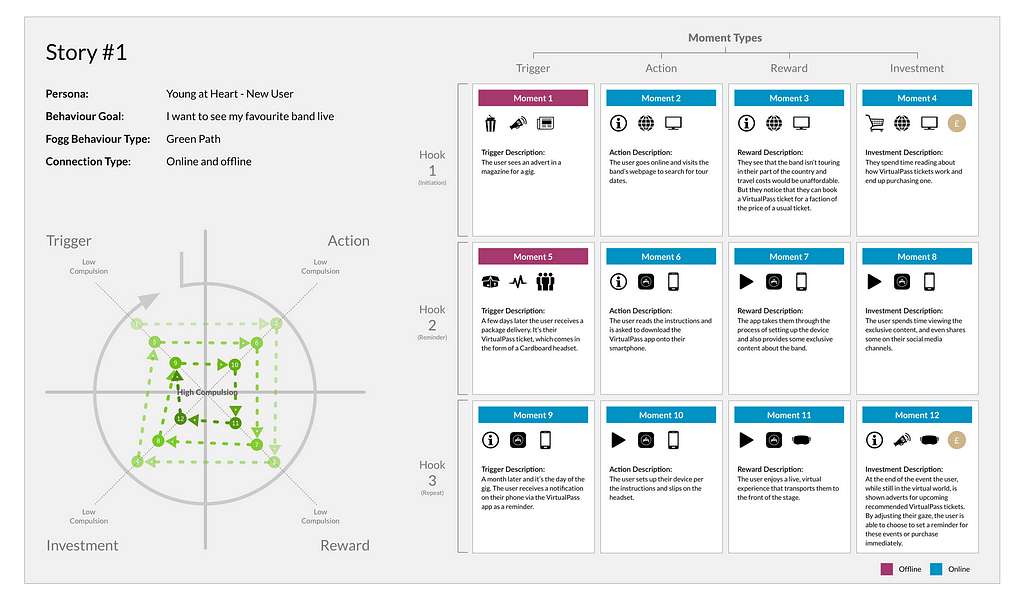
‘Young at Heart’ Persona

This user is between 35–50. They love live music — in fact they used to go to gigs all the time when they were younger — but the chores of everyday life have taken over and finding the time and money to make it to see their favourite band is near impossible. They find solace in technology such as Spotify and Apple Music that allows them to quickly download or stream music — keeping them up-to-date — but they miss the visual ‘experience’ of seeing a band performing live.

User Type: New

Behaviour Goal: I want to see my favourite band live

Fogg Behaviour Type: Green Path (new behaviour)

Connection Type: Online and offline

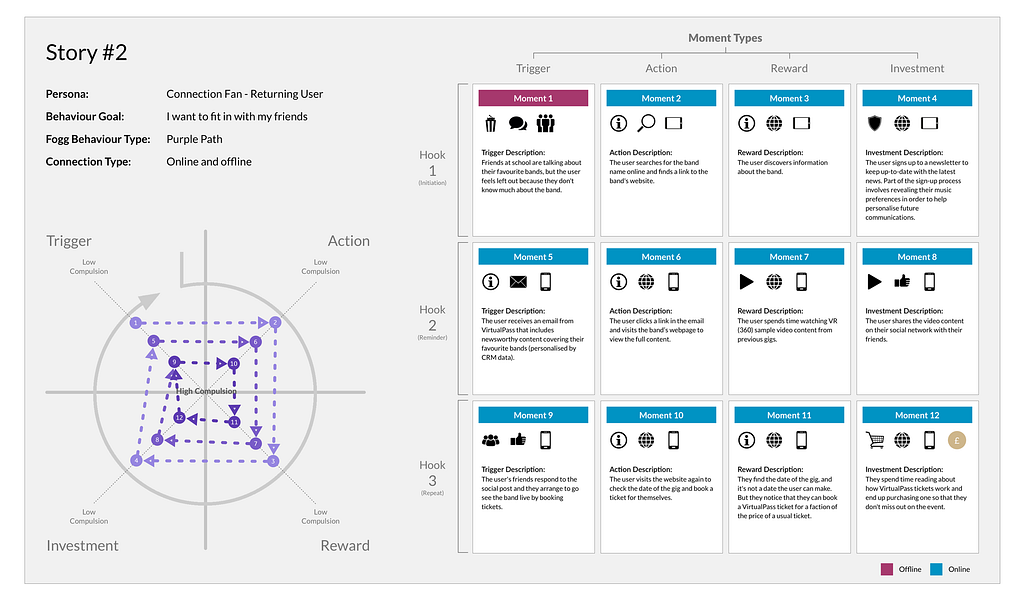
‘Connection Fan’ Persona

This user is between 12–21. Their music tastes are largely dictated by their friends. They are relatively new to live music, and because of their age often have to be chaperoned at gigs. Their experiences of live music are largely contained to user-generated video content that they share on social networks. Sometimes the gigs are too expensive for them to afford, which means they don’t always get to go and the fear of missing out (FOMO) on a social event can be frustrating.

User Type: Returning

Behaviour Goal: I want to fit in with my friends

Fogg Behaviour Type: Purple Path (familiar behaviour)

Connection Type: Online and offline

5. Craft your stories

Taking all of the above into consideration we crafted the following stories for VirtualPass. These are just two examples, and we’d usually expect to create at least three stories per persona.

By following the storyframing process we have now:

  • Identified the viable Services (S), Mediums (M), and Devices (D) at the brand’s disposal (online and offline)
  • Organised those ingredients into Moments (m) that ensure there is always an investment from the user which will bring them back to the brand again
  • Ordered these Moments (m) into a logical narrative that aims to achieve a specific behaviour goal

The brand has benefited by:

  • Having a clear view of the ideal user journey
  • Seeing how and where customers could interact with their brand
  • Identifying the gaps between the desired customer experience and the one actually received
  • Highlighting development priorities and areas of focus e.g. there’s no point developing a smart watch app if users aren’t using them in our stories
  • Allowing the brand to concentrate efforts and expenditure on what matters most to maximise effectiveness

Hopefully this has helped further explain the storyframing process. You can download the icons used for the ingredients here. I welcome feedback from the UX community and encourage you to use this methodology when developing products/services.

The storyframing framework was developed while working at Brandwidth.

If you’ve found this article useful and want to know more about how you can use the storyframing framework to increase the success of your (or your client’s) products and services then write a comment below and I’ll get back to you.

What is Storyframing? ← P R E V I O U S

N E X T → Has ‘user’ become an outdated term?


Storyframing: What we want users to do was originally published in uxdesign.cc – User Experience Design on Medium, where people are continuing the conversation by highlighting and responding to this story.

from uxdesign.cc – User Experience Design – Medium https://uxdesign.cc/storyframing-what-we-want-users-to-do-8ef871903867?source=rss—-138adf9c44c—4

Kristen Stewart has co-authored a paper on artificial intelligence

Here’s a sentence you don’t get to read everyday: Kristen Stewart has surprised the artificial intelligence community by publishing a paper on machine learning.

The Twilight actress recently made her directorial debut with the short film Come Swim, and in it used a machine learning technique known as “style transfer” (where the aesthetics of one image or video is applied to another) to create an impressionistic visual style. Along with special effects engineer Bhautik J Joshi and producer David Shapiro, Stewart has co-authored a paper on this work in the film, publishing it in the popular online repository for non-peer reviewed work, arXiv.

AI researchers and Stewart fans were surprised (and pleased) to discover her contribution to the field:

The paper itself is titled “Bringing Impressionism to Life with Neural Style Transfer in Come Swim,” and offers a detailed case study on how to use this sort of machine learning in a film. The paper describes Come Swim as a “poetic, impressionistic portrait of a heartbroken man underwater,” with the film’s aesthetic grounded by a painting of Stewart’s showing a “man rousing from sleep.”

The team used existing neural networks to transfer the style of this painting onto a test frame, and then fine-tuned their setup by adding “blocks of color and texture” until they’d created the desired painting-like effect. When this transfer process was correctly tuned, they applied it different parts of the film, producing frames like the ones below. It’s a simple technique deployed convincingly.


There is of course a bit of light-hearted snobbery here (“Why on Earth is a Hollywood actress getting involved in machine learning?!”), but the fact is that these machine learning tools, once thought of as esoteric and specialized, have become increasingly mainstream. Open source AI frameworks like Tensor Flow and Keras make it easy for anyone to try and implement code, and the commercialization of specifics techniques like style transfer (even Facebook offers style transfer image filters) pushes this research into popular culture.

Arguably, the AI revolution isn’t just powered by abundant data and GPUs — to truly thrive it also needs an open community and accessible tools. Stewart’s paper is brilliant example of how far we’ve come.

from The Verge http://www.theverge.com/tldr/2017/1/20/14334242/kristen-stewart-machine-learning-paper-ai

Arccos and Microsoft Collaborate to Help Golfers Play Smarter, Shoot Lower Scores Through Big …

The platform layers an Arccos user’s data on top of millions of data points for more than 40,000 golf courses mapped in the Arccos system.

from BigData – Alerts https://www.google.com/url?rct=j&sa=t&url=http://www.prnewswire.com/news-releases/arccos-and-microsoft-collaborate-to-help-golfers-play-smarter-shoot-lower-scores-through-big-data-and-machine-learning-300393734.html&ct=ga&cd=CAIyGjk5YWFjYjJkNzIyNDM5Njk6Y29tOmVuOlVT&usg=AFQjCNHmgj_Pvcf0U4z4tp-wn5LAGgFt3g

R For Beginners: Basic Graphics Code to Produce Informative Graphs, Part Two, Working With Big Data

(This article was first published on r – R Statistics and Programming, and kindly contributed to R-bloggers)

R for beginners: Some basic graphics code to produce informative graphs, part two, working with big data

A tutorial by D. M. Wiig

In part one of this tutorial I discussed the use of R code to produce 3d scatterplots. This is a useful way to produce visual results of multi- variate linear regression models. While visual displays using scatterplots is a useful tool when using most datasets it becomes much more of a challenge when analyzing big data. These types of databases can contain tens of thousands or even millions of cases and hundreds of variables.

Working with these types of data sets involves a number of challenges. If a researcher is interested in using visual presentations such as scatterplots this can be a daunting task. I will start by discussing how scatterplots can be used to provide meaningful visual representation of the relationship between two variables in a simple bivariate model.

To start I will construct a theoretical data set that consists of ten thousand x and y pairs of observations. One method that can be used to accomplish this is to use the R rnorm() function to generate a set of random integers with a specified mean and standard deviation. I will use this function to generate both the x and y variable.

Before starting this tutorial make sure that R is running and that the datasets, LSD, and stats packages have been installed. Use the following code to generate the x and y values such that the mean of x= 10 with a standard deviation of 7, and the mean of y=7 with a standard deviation of 3:

##############################################
## make sure package LSD is loaded
##
library(LSD)
x <- rnorm(50000, mean=10, sd=15)   # # generates x values #stores results in variable x
y <- rnorm(50000, mean=7, sd=3)    ## generates y values #stores results in variable y
####################################################

Now the scatterplot can be created using the code:

##############################################
## plot randomly generated x and y values
##
plot(x,y, main=”Scatterplot of 50,000 points”)
####################################################

screenshot-graphics-device-number-2-active-%27rkward%27

As can be seen the resulting plot is mostly a mass of black with relatively few individual x and y points shown other than the outliers.  We can do a quick histogram on the x values and the y values to check the normality of the resulting distribution. This shown in the code below:
####################################################
## show histogram of x and y distribution
####################################################
hist(x)   ## histogram for x mean=10; sd=15; n=50,000
##
hist(y)   ## histogram for y mean=7; sd=3; n-50,000
####################################################

screenshot-graphics-device-number-2-active-%27rkward%27-5

screenshot-graphics-device-number-2-active-%27rkward%27-4

The histogram shows a normal distribution for both variables. As is expected, in the x vs. y scatterplot the center mass of points is located at the x = 10; y=7 coordinate of the graph as this coordinate contains the mean of each distribution. A more meaningful scatterplot of the dataset can be generated using a the R functions smoothScatter() and heatscatter(). The smoothScatter() function is located in the graphics package and the heatscatter() function is located in the LSD package.

The smoothScatter() function creates a smoothed color density representation of a scatterplot. This allows for a better visual representation of the density of individual values for the x and y pairs. To use the smoothScatter() function with the large dataset created above use the following code:

##############################################
## use smoothScatter function to visualize the scatterplot of #50,000 x ## and y values
## the x and y values should still be in the workspace as #created  above with the rnorm() function
##
smoothScatter(x, y, main = “Smoothed Color Density Representation of 50,000 (x,y) Coordinates”)
##
####################################################

screenshot-graphics-device-number-2-active-%27rkward%27-6

The resulting plot shows several bands of density surrounding the coordinates x=10, y=7 which are the means of the two distributions rather than an indistinguishable mass of dark points.

Similar results can be obtained using the heatscatter() function. This function produces a similar visual based on densities that are represented as color bands. As indicated above, the LSD package should be installed and loaded to access the heatscatter() function. The resulting code is:

##############################################
## produce a heatscatter plot of x and y
##
library(LSD)
heatscatter(x,y, main=”Heat Color Density Representation of 50,000 (x, y) Coordinates”) ## function heatscatter() with #n=50,000
####################################################

screenshot-graphics-device-number-2-active-%27rkward%27-7

In comparing this plot with the smoothScatter() plot one can more clearly see the distinctive density bands surrounding the coordinates x=10, y=7. You may also notice depending on the computer you are using that there is a noticeably longer processing time required to produce the heatscatter() plot.

This tutorial has hopefully provided some useful information relative to visual displays of large data sets. In the next segment I will discuss how these techniques can be used on a live database containing millions of cases.

To leave a comment for the author, please follow the link and comment on their blog: r – R Statistics and Programming.

R-bloggers.com offers daily e-mail updates about R news and tutorials on topics such as: Data science, Big Data, R jobs, visualization (ggplot2, Boxplots, maps, animation), programming (RStudio, Sweave, LaTeX, SQL, Eclipse, git, hadoop, Web Scraping) statistics (regression, PCA, time series, trading) and more…

from R-bloggers https://www.r-bloggers.com/r-for-beginners-basic-graphics-code-to-produce-informative-graphs-part-two-working-with-big-data/