The Internet, Blockchain, and the Evolution of Foundational Innovations

Last year, a panel of global experts convened by the World Economic Forum selected blockchain as one of the Top Ten Emerging Technologies for 2016, based on its potential to fundamentally change the way economies work. But, how transformative will blockchain turn out to be? How long is the transformation likely to take? And how […]

from CIO Journal. http://blogs.wsj.com/cio/2017/01/20/the-internet-blockchain-and-the-evolution-of-foundational-innovations/?mod=WSJBlog

Storyframing: What we want users to do

By Steve McCarthy

In September 2016 I posted an article on a new method for defining user stories and journeys called Storyframing. More specifically it was a method for…

Designing a digital service or product around distinct user behaviour, helping to ensure user adoption and repeat use are front of mind from the outset of a project.

The process was born out of a frustration for not having a readily available framework that considered behaviour change or long term user engagement in detail.

Feedback from the UX community was positive and some of the readers suggested that I share more information on the Storyframing method…

An idea…

Not everyone gets to see their favourite bands in concert.

Obstacles like ticket costs, age limits, and location can make it difficult for fans to experience live music.

But what if we could transport customers to the front of the stage using VR? What if the number of tickets a band could sell wasn’t constrained by the capacity of a stadium?

VirtualPass (a fictional company) is a startup who have had that very idea. They now want to better understand how their service is best placed to create compelling stories for their potential customers.

Time to start storyframing…

1. Categorise your users

VirtualPass* have two core user personas they want to target:

i. Young at Heart — New Users

ii. Connection Fan — Returning Users

2. Define your moment ingredients

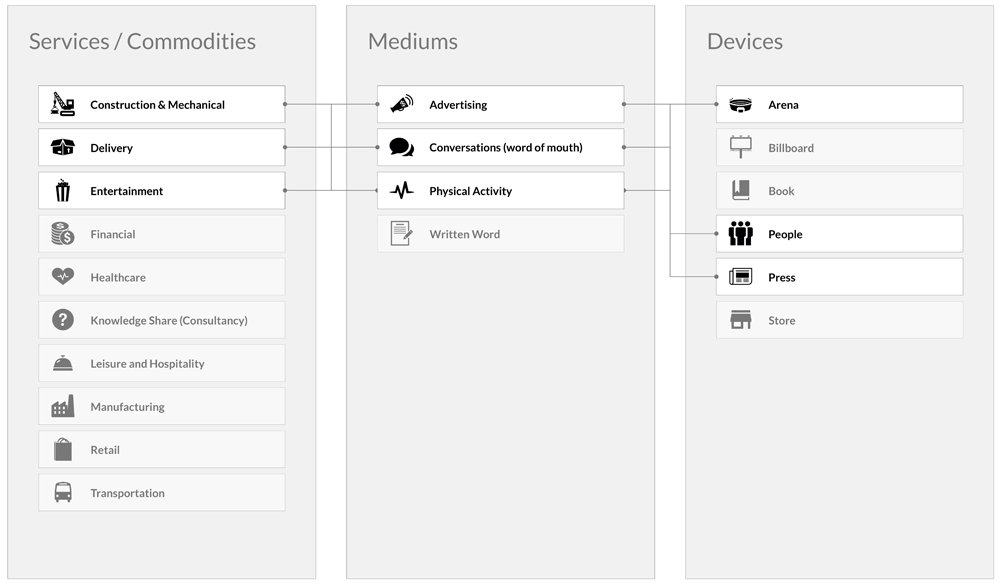
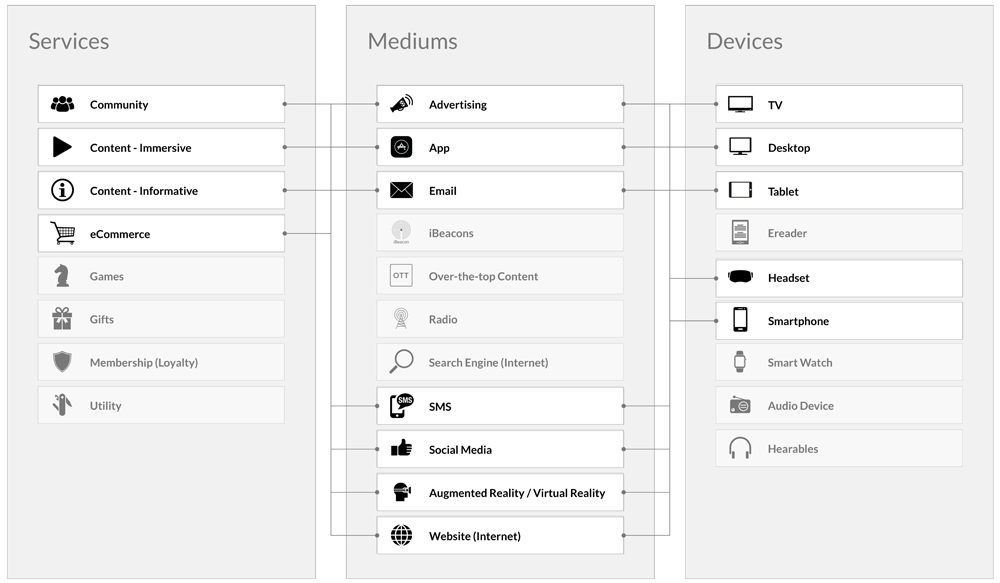
Following a stakeholder workshop with the brand we identified the following as viable Services (S), Mediums (M), and Devices (D) at their disposal:

Offline Ingredients
Online Ingredients

3. Understand moment types

This is an easy step. We’ve storyframed before so we know that there are 4 types of Moments (m):

  • Trigger (Tm) moments
  • Action (Am) moments
  • Reward (Rm) moments
  • Investment (Im) moments

We just need to keep this in mind for when we start to craft our stories.

4. Set behaviour goals

By returning to the brand’s pre-existing persona work we can draw from actual user sentiment in order to identify their behaviour goals. If the brand hadn’t conducted this type of research then this is something we would recommend before continuing. Otherwise we risk designing a product that nobody wants.

‘Young at Heart’ Persona

This user is between 35–50. They love live music — in fact they used to go to gigs all the time when they were younger — but the chores of everyday life have taken over and finding the time and money to make it to see their favourite band is near impossible. They find solace in technology such as Spotify and Apple Music that allows them to quickly download or stream music — keeping them up-to-date — but they miss the visual ‘experience’ of seeing a band performing live.

User Type: New

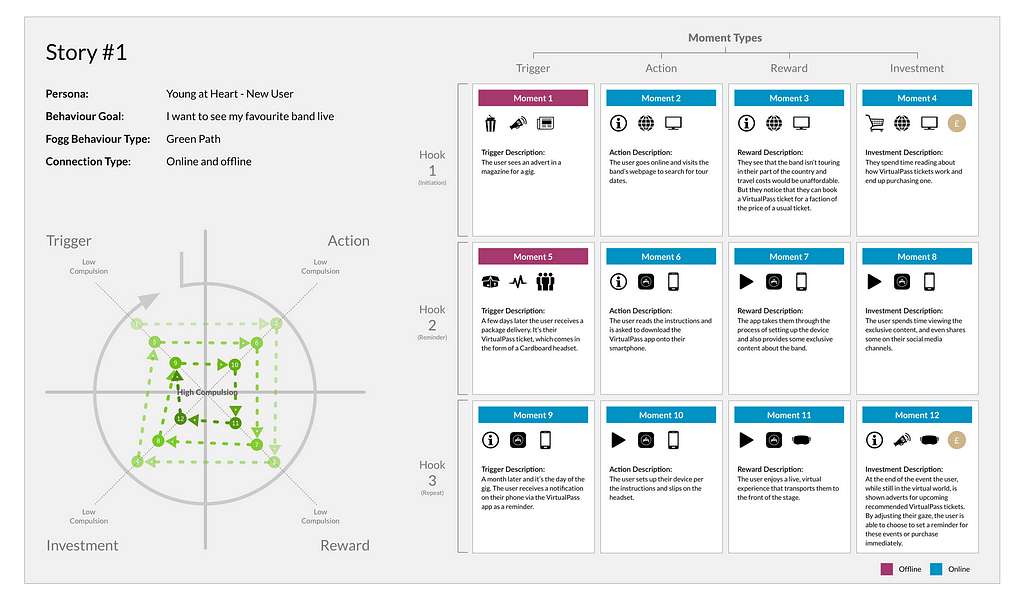
Behaviour Goal: I want to see my favourite band live

Fogg Behaviour Type: Green Path (new behaviour)

Connection Type: Online and offline

‘Connection Fan’ Persona

This user is between 12–21. Their music tastes are largely dictated by their friends. They are relatively new to live music, and because of their age often have to be chaperoned at gigs. Their experiences of live music are largely contained to user-generated video content that they share on social networks. Sometimes the gigs are too expensive for them to afford, which means they don’t always get to go and the fear of missing out (FOMO) on a social event can be frustrating.

User Type: Returning

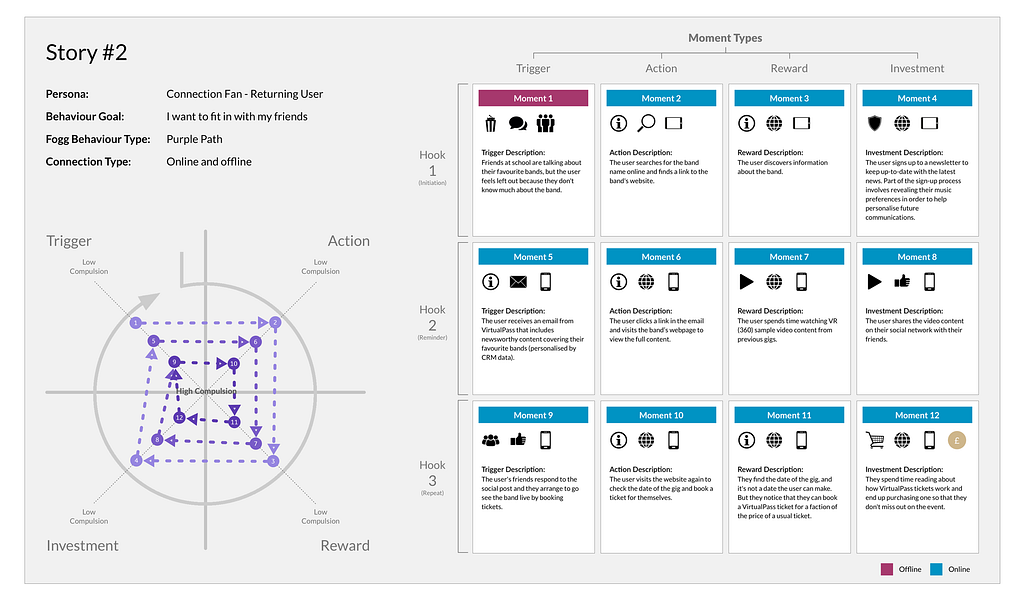
Behaviour Goal: I want to fit in with my friends

Fogg Behaviour Type: Purple Path (familiar behaviour)

Connection Type: Online and offline

5. Craft your stories

Taking all of the above into consideration we crafted the following stories for VirtualPass. These are just two examples, and we’d usually expect to create at least three stories per persona.

By following the storyframing process we have now:

  • Identified the viable Services (S), Mediums (M), and Devices (D) at the brand’s disposal (online and offline)
  • Organised those ingredients into Moments (m) that ensure there is always an investment from the user which will bring them back to the brand again
  • Ordered these Moments (m) into a logical narrative that aims to achieve a specific behaviour goal

The brand has benefited by:

  • Having a clear view of the ideal user journey
  • Seeing how and where customers could interact with their brand
  • Identifying the gaps between the desired customer experience and the one actually received
  • Highlighting development priorities and areas of focus e.g. there’s no point developing a smart watch app if users aren’t using them in our stories
  • Allowing the brand to concentrate efforts and expenditure on what matters most to maximise effectiveness

Hopefully this has helped further explain the storyframing process. You can download the icons used for the ingredients here. I welcome feedback from the UX community and encourage you to use this methodology when developing products/services.

The storyframing framework was developed while working at Brandwidth.

If you’ve found this article useful and want to know more about how you can use the storyframing framework to increase the success of your (or your client’s) products and services then write a comment below and I’ll get back to you.

What is Storyframing? ← P R E V I O U S

N E X T → Has ‘user’ become an outdated term?


Storyframing: What we want users to do was originally published in uxdesign.cc – User Experience Design on Medium, where people are continuing the conversation by highlighting and responding to this story.

from uxdesign.cc – User Experience Design – Medium https://uxdesign.cc/storyframing-what-we-want-users-to-do-8ef871903867?source=rss—-138adf9c44c—4

Kristen Stewart has co-authored a paper on artificial intelligence

Here’s a sentence you don’t get to read everyday: Kristen Stewart has surprised the artificial intelligence community by publishing a paper on machine learning.

The Twilight actress recently made her directorial debut with the short film Come Swim, and in it used a machine learning technique known as “style transfer” (where the aesthetics of one image or video is applied to another) to create an impressionistic visual style. Along with special effects engineer Bhautik J Joshi and producer David Shapiro, Stewart has co-authored a paper on this work in the film, publishing it in the popular online repository for non-peer reviewed work, arXiv.

AI researchers and Stewart fans were surprised (and pleased) to discover her contribution to the field:

The paper itself is titled “Bringing Impressionism to Life with Neural Style Transfer in Come Swim,” and offers a detailed case study on how to use this sort of machine learning in a film. The paper describes Come Swim as a “poetic, impressionistic portrait of a heartbroken man underwater,” with the film’s aesthetic grounded by a painting of Stewart’s showing a “man rousing from sleep.”

The team used existing neural networks to transfer the style of this painting onto a test frame, and then fine-tuned their setup by adding “blocks of color and texture” until they’d created the desired painting-like effect. When this transfer process was correctly tuned, they applied it different parts of the film, producing frames like the ones below. It’s a simple technique deployed convincingly.


There is of course a bit of light-hearted snobbery here (“Why on Earth is a Hollywood actress getting involved in machine learning?!”), but the fact is that these machine learning tools, once thought of as esoteric and specialized, have become increasingly mainstream. Open source AI frameworks like Tensor Flow and Keras make it easy for anyone to try and implement code, and the commercialization of specifics techniques like style transfer (even Facebook offers style transfer image filters) pushes this research into popular culture.

Arguably, the AI revolution isn’t just powered by abundant data and GPUs — to truly thrive it also needs an open community and accessible tools. Stewart’s paper is brilliant example of how far we’ve come.

from The Verge http://www.theverge.com/tldr/2017/1/20/14334242/kristen-stewart-machine-learning-paper-ai

Arccos and Microsoft Collaborate to Help Golfers Play Smarter, Shoot Lower Scores Through Big …

The platform layers an Arccos user’s data on top of millions of data points for more than 40,000 golf courses mapped in the Arccos system.

from BigData – Alerts https://www.google.com/url?rct=j&sa=t&url=http://www.prnewswire.com/news-releases/arccos-and-microsoft-collaborate-to-help-golfers-play-smarter-shoot-lower-scores-through-big-data-and-machine-learning-300393734.html&ct=ga&cd=CAIyGjk5YWFjYjJkNzIyNDM5Njk6Y29tOmVuOlVT&usg=AFQjCNHmgj_Pvcf0U4z4tp-wn5LAGgFt3g

R For Beginners: Basic Graphics Code to Produce Informative Graphs, Part Two, Working With Big Data

(This article was first published on r – R Statistics and Programming, and kindly contributed to R-bloggers)

R for beginners: Some basic graphics code to produce informative graphs, part two, working with big data

A tutorial by D. M. Wiig

In part one of this tutorial I discussed the use of R code to produce 3d scatterplots. This is a useful way to produce visual results of multi- variate linear regression models. While visual displays using scatterplots is a useful tool when using most datasets it becomes much more of a challenge when analyzing big data. These types of databases can contain tens of thousands or even millions of cases and hundreds of variables.

Working with these types of data sets involves a number of challenges. If a researcher is interested in using visual presentations such as scatterplots this can be a daunting task. I will start by discussing how scatterplots can be used to provide meaningful visual representation of the relationship between two variables in a simple bivariate model.

To start I will construct a theoretical data set that consists of ten thousand x and y pairs of observations. One method that can be used to accomplish this is to use the R rnorm() function to generate a set of random integers with a specified mean and standard deviation. I will use this function to generate both the x and y variable.

Before starting this tutorial make sure that R is running and that the datasets, LSD, and stats packages have been installed. Use the following code to generate the x and y values such that the mean of x= 10 with a standard deviation of 7, and the mean of y=7 with a standard deviation of 3:

##############################################
## make sure package LSD is loaded
##
library(LSD)
x <- rnorm(50000, mean=10, sd=15)   # # generates x values #stores results in variable x
y <- rnorm(50000, mean=7, sd=3)    ## generates y values #stores results in variable y
####################################################

Now the scatterplot can be created using the code:

##############################################
## plot randomly generated x and y values
##
plot(x,y, main=”Scatterplot of 50,000 points”)
####################################################

screenshot-graphics-device-number-2-active-%27rkward%27

As can be seen the resulting plot is mostly a mass of black with relatively few individual x and y points shown other than the outliers.  We can do a quick histogram on the x values and the y values to check the normality of the resulting distribution. This shown in the code below:
####################################################
## show histogram of x and y distribution
####################################################
hist(x)   ## histogram for x mean=10; sd=15; n=50,000
##
hist(y)   ## histogram for y mean=7; sd=3; n-50,000
####################################################

screenshot-graphics-device-number-2-active-%27rkward%27-5

screenshot-graphics-device-number-2-active-%27rkward%27-4

The histogram shows a normal distribution for both variables. As is expected, in the x vs. y scatterplot the center mass of points is located at the x = 10; y=7 coordinate of the graph as this coordinate contains the mean of each distribution. A more meaningful scatterplot of the dataset can be generated using a the R functions smoothScatter() and heatscatter(). The smoothScatter() function is located in the graphics package and the heatscatter() function is located in the LSD package.

The smoothScatter() function creates a smoothed color density representation of a scatterplot. This allows for a better visual representation of the density of individual values for the x and y pairs. To use the smoothScatter() function with the large dataset created above use the following code:

##############################################
## use smoothScatter function to visualize the scatterplot of #50,000 x ## and y values
## the x and y values should still be in the workspace as #created  above with the rnorm() function
##
smoothScatter(x, y, main = “Smoothed Color Density Representation of 50,000 (x,y) Coordinates”)
##
####################################################

screenshot-graphics-device-number-2-active-%27rkward%27-6

The resulting plot shows several bands of density surrounding the coordinates x=10, y=7 which are the means of the two distributions rather than an indistinguishable mass of dark points.

Similar results can be obtained using the heatscatter() function. This function produces a similar visual based on densities that are represented as color bands. As indicated above, the LSD package should be installed and loaded to access the heatscatter() function. The resulting code is:

##############################################
## produce a heatscatter plot of x and y
##
library(LSD)
heatscatter(x,y, main=”Heat Color Density Representation of 50,000 (x, y) Coordinates”) ## function heatscatter() with #n=50,000
####################################################

screenshot-graphics-device-number-2-active-%27rkward%27-7

In comparing this plot with the smoothScatter() plot one can more clearly see the distinctive density bands surrounding the coordinates x=10, y=7. You may also notice depending on the computer you are using that there is a noticeably longer processing time required to produce the heatscatter() plot.

This tutorial has hopefully provided some useful information relative to visual displays of large data sets. In the next segment I will discuss how these techniques can be used on a live database containing millions of cases.

To leave a comment for the author, please follow the link and comment on their blog: r – R Statistics and Programming.

R-bloggers.com offers daily e-mail updates about R news and tutorials on topics such as: Data science, Big Data, R jobs, visualization (ggplot2, Boxplots, maps, animation), programming (RStudio, Sweave, LaTeX, SQL, Eclipse, git, hadoop, Web Scraping) statistics (regression, PCA, time series, trading) and more…

from R-bloggers https://www.r-bloggers.com/r-for-beginners-basic-graphics-code-to-produce-informative-graphs-part-two-working-with-big-data/

Nagbot Sends Mean Texts to Help You Stick to Your Resolutions

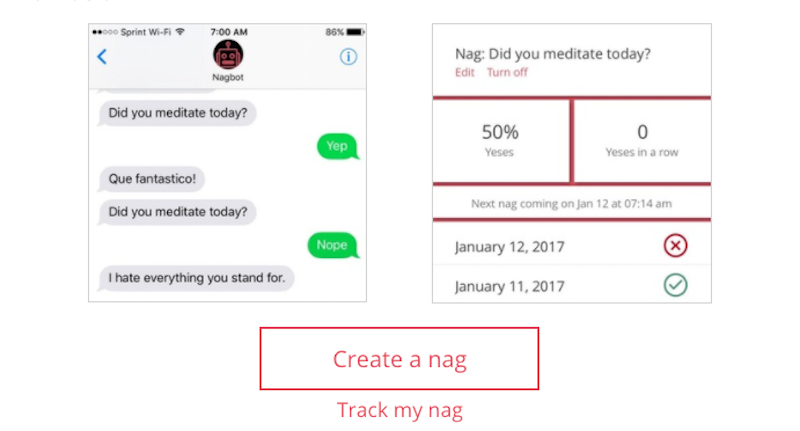
If you’ve made resolutions, you don’t want to forget about them when the novelty of the new year has worn off. Nagbot is a fun texting app that helps you stick to your goals by texting you regular reminders.

To create a nag, you enter your name, phone number, and goal into Nagbot’s website. From there, you can choose how often and when you want Nagbot to nag you. You’ll also decide how mean you want it to be, from “You’ll get ‘em next time!” to “You’re dead to me.” The tool is similar to apps like Streaks in that it sends you daily (or weekly) reminders to work on a task. However, it’s a little sassier and simpler, and perhaps more importantly, it’s free. You can also opt out of the texts whenever you want with “STOP.”

Nagbot has a really simple goal tracking function, too. When it texts you, you get a link you can use to check your goal progress on Nagbot’s website. You obviously have to provide your number, but their privacy policy explicitly states, “Nagbot will not rent or sell potentially personally-identifying and personally-identifying information to anyone.”

Head to the link below to give it a try.

Nagbot via ProductHunt

from Lifehacker, tips and downloads for getting things done http://lifehacker.com/nagbot-sends-mean-texts-to-help-you-stick-to-your-resol-1791188092

Why The Law of Large Numbers is Just an Excuse

big_numberEveryone has tough quarters, and usually, at least one tough year (more on that here).

As we approach $10m, and then again as we approach $20m, and then again as we approach $X0m … we often blame a factor that I believe rarely is really real — The Law of Large Numbers.

The Law of Large Numbers is really two excuses rolled into one:

  • Our market isn’t that big.  So of course, by $Xm in ARR, or $1Xm in ARR, growth is going to slow down a lot.  We’re doing as well as we can be expected, given how niche our market is.
  • No way we can add that much more revenue this year.  The real challenge in SaaS is that, let’s say you just want to go from $5m last year to $10m  this year.  That means, net of churn, you have to sell more this year than every other year before combined.  If you aren’t just crushing it, that can feel close to impossible.  How can we add as much or more revenue this year than every past year put together?  Goodness.

So you excuse slower growth this year due to the Law of Large Numbers.

Now if that were true, it would indeed be the perfect excuse.  But bear in mind, there are several “counter-winds” to the Law of Large Numbers:

  • Every SaaS Market is Bigger Than Ever.  Look at the latest batch of IPOs, from Twilio to Coupa to Appdynamics and more.  They are all growing at 70%+ at $100m+ in ARR (more on that here).  It’s not because they are “better” than the last generation of SaaS IPOs.  It’s because the markets are bigger.  And if all SaaS markets are bigger, if every segment of business is moving more and more to the cloud … then even if the Law of Large Numbers is true for you … it should be true later.
  • Upsell, Net Negative Churn, and Second Order Revenue Come to the Rescue.  If you have happy customers and high NPS/CSAT … then at least around $4m-$5m in ARR, generally, your existing customer base itself starts to create real revenue.  As a rough rule, aim for at least 120% net revenue from your trailing customer base by the time you hit $4m-$5m in ARR.  That means that, if you execute well here, a big chunk of your growth for this year comes from customers you already closed last year.  That means it gets easier, folks.  Because last year you didn’t have the big base to upsell to.
  • Screen Shot 2017-01-16 at 10.35.39 AMEveryone Gets Better at Driving Up Deal Sizes and ACVs.  Over time, everyone learns their customer base and how to add more value.  The combination usually means you are able to drive up deal sizes, pricing, and ACV.  If you drive up the average deal size just 10-20% this year, that again makes growing your total ARR easier.  It’s just math.  Everyone that gets good at selling a product learns how at least to drive deal sizes up at least a smidge.  Everyone.
  • Your Brand Boosts Marketing (and Pricing).  Once you hit just a few million in ARR, you’ll start to develop a mini-brand.  And once you hit $10m in ARR or so, you’ll almost certainly have a real brand in your space.  Once you have a brand, even with a mediocre marketing team, you’ll get pulled into more and more deals.  And once you have a trusted brand, you can change at the high end of the market.  The combination of the two makes it easier to scale.  If you have a positive, high NPS brand in your space and you aren’t getting better and better leads … you’re marketing team is simply terrible.  Make a change tomorrow.  Maybe even tonight.
  • Your Team Gets Better.  This is why you want zero voluntary attrition in your sales team.  Or probably, your customer success, team too.  And your demand gen team.  Everyone that is truly good gets better.  Your best sales reps just have it dialed in.  Your CS team knows exactly where the land mines are in saving customers, and how to get them to buy more seats.  Everyone just gets better in their second and third year.  This makes growing revenue easier, too.  Your team just wasn’t as seasoned last year.
  • The Great Teams Figure it Out.  And finally, let’s be clear.  The Law of Large Numbers does hit you earlier if you don’t expand your market, and redefine it.  Your very initial 1.0 product may only have a $10m TAM.  But the best teams always expand and redefine their markets.  It’s not easy.  But they always get it done before it impacts ARR growth materially.

So my hope here is that, if nothing else, we’ve challenged your anxiety around the Law of Large Markets.  I had this anxiety, myself.  We probably all do.

But great teams solve it.

And if you are hitting a LOLN wall … that’s a clear sign.  A clear sign:

  • You are way behind in adding, and/or upgrading, your senior team.
  • And probably a clear sign you are behind on NPS and CSAT.

Just upgrade those two.

You will probably get right back on track.

from SaaStr http://www.saastr.com/why-the-law-of-large-numbers-is-just-an-excuse/

What Happened When I Stopped Saying “Sorry” At Work For A Week

We all say “I’m sorry” too often—that much you already know. And, trust me, I’m right in that boat with you. I’m consciously aware of the fact that I’m a chronic over-apologizer.

Sure, I’ve read the countless articles about apps that could help me and little tweaks that could stop me in my tracks before those two small words mindlessly fly out of my mouth. But in all honesty, very little of it has worked for me. Nothing really sticks, and I still catch myself apologizing way more often than I should.

That is, until recently. I saw this Tumblr post circulating around the internet, and it piqued my interest.

Instead of attempting to stop yourself from saying something altogether, the user suggests replacing that oft-repeated “I’m sorry” with two different words: “Thank you.” This flips the script and changes something that could be perceived as a negative mistake into a moment for you to express your gratitude and appreciation.

Sounds great in theory, right? But how practical could it actually be? Would this be yet another suggested phrase that gets thrown out of the window the second I feel tempted to apologize?

Naturally, I felt the need to test it out myself—which is exactly what I’ve been doing over the course of the past week. It involves quite a bit of conscious thought (yes, there have been plenty of times when an apology was dancing on my lips, and I managed to catch it just in time). But so far I’ve managed to be pretty consistent with this change.

When an editor pointed out an error I had made in one of my articles, I didn’t respond immediately with, “Ugh, I’m so sorry about that!” Instead, I sent a reply with a line that read, “Thank you for that helpful note!”

And like the Tumblr user, when I ran late for a coffee meeting with a networking acquaintance, I resisted the urge to apologize profusely and instead thanked her for waiting for me.

While it does take a little bit of effort on your end (and, fair warning, you might slip up a few times at first), swapping out these words is still a relatively small change for you to make. But rest assured, so far I’ve noticed a big impact—more so with myself than with the people I had been apologizing to.

When I had previously spewed out countless sorries, I spent a good chunk of time feeling guilty. I had begun our exchange with something negative, which then seemed to cast a dark shadow over the rest of our conversation—like I had started things off on the wrong foot and needed to spend the rest of my time proving myself and recovering for my faux pas.

But by switching that negative to a positive, I found that I could move on from my slip-up much faster. I didn’t need to spend time mentally obsessing over what I had screwed up, because my genuine “thank you” had provided a much more natural segue into a different discussion—rather than the awkward exchange that typically follows an apology.

Needless to say, this is a change I plan to continue to implement to improve my communication skills. It’s the only thing I’ve found that actually halts my over-apologizing. And as an added bonus, it transforms those previously remorse-filled exchanges into something constructive and upbeat. What more could you want?


This article originally appeared on The Daily Muse and is reprinted with permission.

from Co.Labs https://www.fastcompany.com/3067232/what-happened-when-i-stopped-saying-sorry-at-work-for-a-week?partner=rss

A Designer’s Guide to Perceived Performance

A well-designed site isn’t how easy it is to use or how elegant it looks. A site isn’t well-designed unless the user is satisfied with their experience. An overlooked aspect of this experience is performance. A slow, beautiful site will always be less satisfying to use than an inelegant fast site. It takes a user just three seconds to decide to abandon a website.

“To the typical user, speed doesn’t only mean performance. Users’ perception of your site’s speed is heavily influenced by their overall experience, including how efficiently they can get what they want out of your site and how responsive your site feels.” – Roma Shah, User Experience Researcher

“A slow, beautiful site will always be less satisfying to use than an inelegant fast site.”

At the surface, performance is achieved through compression, cutting out extra lines of code and more, but there are limits to what can be achieved at a technological level. Designers need to consider the perceived performance of an experience to make it feel fast.

“There are two kinds of time: clock time and brain time.”

There are two kinds of time: clock time and brain time. The former is the objective measure of time; the latter is how a person perceives time. This is important to people involved in human-computer interaction, because we can manipulate a person’s perception of time. In our industry, this manipulation is called the perception of performance.

How Quick is Appropriate?

This visual demonstrates how we perceive time. Anything less than one second is perceived as ‘instant’ behaviour, it is almost unnoticeable. Up to one second is immediate, anything more than this is when the user realises they are waiting.

Instant behaviour could be an interface providing feedback. The user should not have to wait for this, they should get a message within 0.2s of clicking a button.

Immediate behaviour could be a page loading. The user should not have to wait any more than 1 or 2 seconds for the results they want to load.

If an interface needs that extra time, we should say ‘this may take a few more seconds’ and provide feedback on how long it will take. Don’t leave the user asking too many questions.

Active & Passive Modes

Humans do not like waiting. We need to consider the different modes a person is in when using a website or application: the active and passive modes. During the active mode users do not realise they are waiting at all; during the passive mode their brain activity drops and they get bored.

“It takes a user just three seconds to decide to abandon a website.”

You can keep people in the active mode by pre-loading content. Modern browsers do this while you are typing in a URL or searching in the address bar. Instagram achieves this by beginning to upload photographs in the background the moment you choose a photograph and starting creating the post to make the upload feel instant.

instagram

Instagram also shows an obscured preview of images that have not yet loaded.

“As designers, we should do everything we can to keep our users in the active mode.”

Display content as soon as you can to reduce the amount of time a user is in the passive mode. YouTube does this by streaming the video to the user despite it not being 100% downloaded. Instead, it estimates how fast the user can stream, and waits for that portion of the video to load, automatically chooses a bitrate, and starts playing it. Only buffering when absolutely necessary.

Both methods require us to prioritise the content we want, and load the rest of the page around it.

“Your page needs to load 20% faster for your users to notice any difference.”

Your page needs to load 20% faster for your users to notice any difference. If your page takes 8s to load today, a new version needs to take 6.4s to load for it to feel faster. Anything less than 20% is difficult to justify.

Helping Developers

Even if you understand all aspects of page speed, you should be thinking about it the moment you start creating a design system for a UI, working with the development team to fine-tune performance and figure out where marginal gains can be had.

This could be as simple as ensuring you provide loading states and fallbacks (failed states) to your developers so the user doesn’t have to wait for the entire page to load before they can read anything.

Here’s a short step-by-step guide to ensuring you are considering performance when designing:

  • Research the priority content that should load in your interface. If it’s a news article, the text content should load first, allowing the user to start reading before the experience has even finished loading.
  • Provide a loading state (e.g. placeholder content) and a fallback (e.g. un-styled text) for all elements you design and use.
  • Work with the developers to fine tune performance and work out what technologies can be used to ensure quick loading (e.g. browser caching and progressive jpegs).
slack-placeholder-content

Slack take a common approach of placeholder content to imply what the user is going to see, making progress feel faster than it is. A blank screen here would be frustrating.

These tasks may seem complete, but it is important to revisit your work and fine-tune to make as many marginal gains as possible.

Measuring Performance

A way to measure perceived performance is by inviting users to navigate your site and asking them to estimate how long it took to load. Another option is to provide multiple experiences and ask which is faster.

perceived-performance-survey

A survey can be as simple as a scale like this one. Get enough answers, and you have a clear average.

The sample should be large enough to gather a realistic average that takes into account different perceptions and, if remote, the varying connection speeds of your participants.

“A site isn’t well-designed unless the user is satisfied with their experience.”

Once you have measured the perceived performance, you should continue to tweak it, perform research, and make further improvements. Things can only get better. Keep tweaking until it’s at a point you’re happy with it, then tweak again.

Further Reading

If you want to dig deeper into the perception of speed, check out the following resources:

from Sidebar http://sidebar.io/out?url=https%3A%2F%2Fblog.marvelapp.com%2Fa-designers-guide-to-perceived-performance%2F