Co-authored with Guido Baena Wehrmann (Guidobw)
TL;DR: Design systems are a crucial success factor for digital businesses, and virtually every major player works with one. Still, they can sometimes be hard to sell to management. Here’s a ready-to-use formula to calculate the ROI of any design system.
Design systems have become a standard in the digital industry. Virtually every big player uses one — from Amazon over Google and Airbnb to Uber. There have been numerous studies and reports on their efficacy in improving productivity, reducing bugs, and improving digital products (e.g., Boehm & Basili, 2001; Klüver, 2019; Loomer, 2016; Ray, 2018; Slack, 2019; Sparkbox, n.d.). And yet — as we have experienced in various jobs firsthand — it’s still a common situation that the value of having a design system has to be proven again and again.
For many features implemented in digital products, a simple competitive benchmark is enough to convince management, particularly in e-commerce. “If everyone else is doing it, we can just copy with pride,” is an often-heard statement. But the same standard seems not to apply to design systems.
This is most probably due to the fact that, at least at first, design systems are perceived as a very abstract investment — the value they’ll ultimately produce is not immediately visible and noticeable. On top, the upfront investment can seem huge to management compared to smaller, more concrete features design and development teams could be working on that produce more graspable value (and technical/design debt) more quickly.
Hence, the necessity to prove the value of a new design system beyond a simple competitive benchmark is a reality everyone who wants to get started with this topic must face, as Ben Callahan has already noted in a previous article on the topic (Callahan, 2021). We’ve personally done it time and again.
To make this reality more manageable for everyone, based on our experience, we’ve devised a general formula to approximate the return of investment (ROI) of a design system with a minimum of parameters. We see this as a handy complement to the great but a little more strategic advice Callahan (2021) already provides on how to sell a design system.
In the following, we will first give a very brief introduction to design systems. Subsequently, we’ll introduce our formula, elaborate on the assumptions we made, and explain the different parameters you can tweak. We’ll conclude with a specific example of how to apply it.
A Very Brief Introduction to Design Systems
A design system is a “collection of reusable components, guided by clear standards, that can be assembled together to build any number of applications.” (Fanguy, 2019). Examples of design systems are Material Design by Google, Lightning by Salesforce, and Polaris by Shopify. Zalando also has a design system, about which they regularly write on Medium. In general, it is safe to say that design systems have become a staple in every serious digital organization, independent of the kind of industry.
It is important to note here that design systems should not be confused with mere style guides or simple component libraries (Speicher, 2020). A true design system spans the whole organization in terms of interaction and visual design, engineering, brand design, content, and so on. It introduces clear guidelines on how and why to use them, particularly in combination, on top of the ‘simple’ components.
“A design system [sometimes also called a ‘design language’] is a set of standards to manage design at scale by reducing redundancy while creating a shared language and visual consistency across different pages and channels.”
— Fessenden (2021)
It allows for creating and replicating design work quickly and at scale, alleviating strain on design and development resources. It leads to less repetitive work, which enables a focus on larger, more complex problems, more creativity, more innovation, and therefore has a wide range of advantages:
- More quality and consistency (cf. Wong, 2019);
- Reduced time inefficiency;
- A unified language within and between cross-functional teams;
- Visual consistency across products, channels, and departments;
- An educational tool and reference, e.g., for quicker onboarding;
- A single source of truth for designers, developers, and all other stakeholders.
We believe that if Henry Ford lived today and worked on a digital Model T, he’d use a design system.
There are different ways a design system can be built and maintained within an organization, the two most popular ones being the centralized model and the federated model (Curtis, 2015). We base this article, and our formula, on the federated model, which means that designers and developers work out “what the system is and spread[ing] it out to everyone else. Without quitting their day jobs on product teams.” (Curtis, 2015) We do this for two reasons.
First, if you have trouble gaining management buy-in in the first place, arguing for a centralized model — with a dedicated team taking care of the design system — might only complicate the mission further. A federated approach is a good starting point because designers and developers can simply get working on the design system ‘on the side.’ It can then be transformed into a centralized model — or a hybrid one (cf. Manwaring & Mateo, 2018) — once the value of the design system has been recognized.
Second, in a centralized model, a design system often evolves into a product of its own, complete with product managers, customer support, and so on. However, for the sake of keeping our formula as feasible as possible, we’re focusing only on designers and developers in the following. Design system‒induced productivity gains for such teams are easy to benchmark, and you’ll see that just this limited scope already makes for a very compelling case.
The ROI of a Design System
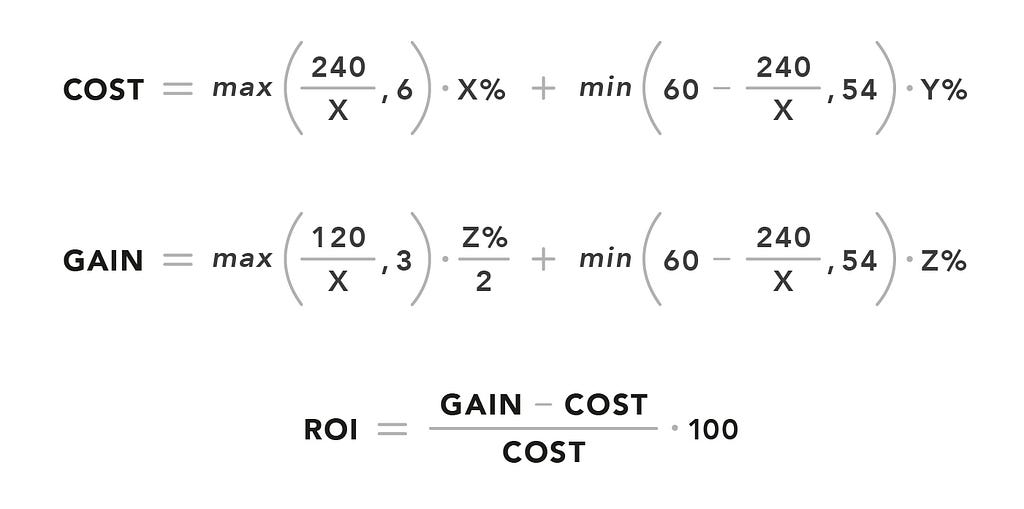
Our design system ROI formula has two components:
- What you’ll gain over time from the design system you build;
- What building and maintaining will cost you.
Having calculated these two components, it’s straightforward to use them in the standard formula to calculate ROI. In the following, we’ll explain all of the different parts in more detail.
Assumptions
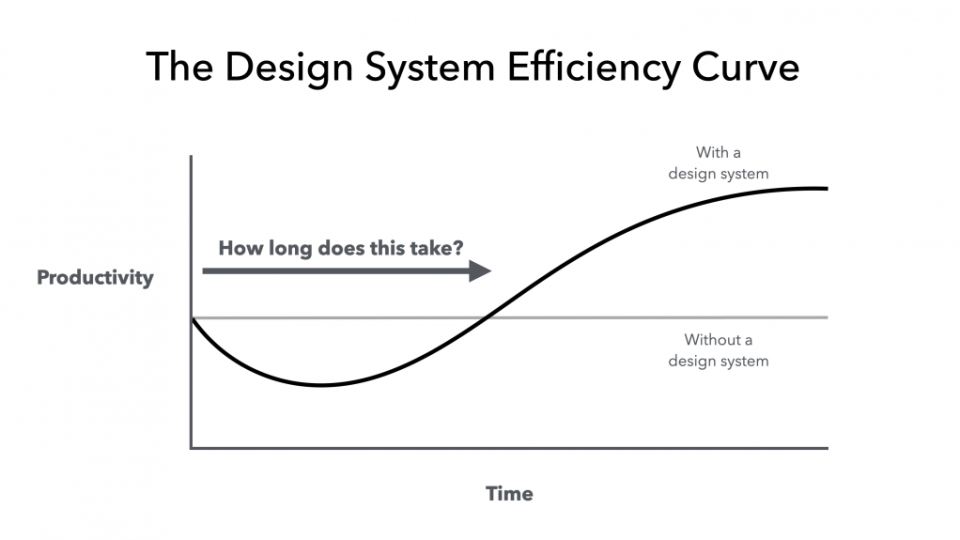
Our formula orients at the ‘Design System Efficiency Curve,’ i.e., at first, you’ll see a drop in productivity due to the necessary upfront investment. Still, after a break-even point where the design system has grown enough to compensate for that, productivity gains are significant.
For a specific formula, however, it’s necessary to make some (conservative but adjustable) assumptions. In our case, we have agreed on the general assumptions below in discussions within a design system task force comprising representatives from our design and engineering teams at BestSecret Group.
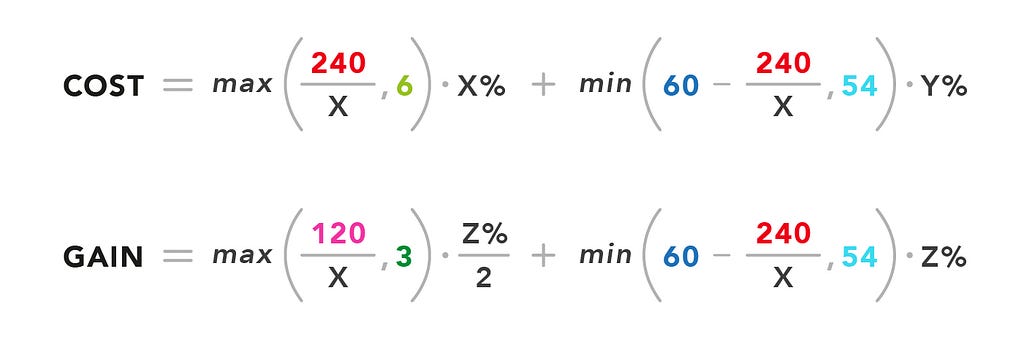
- A design system is ‘good’ for five years (= 60 months). That is, we anticipate a major revamp roughly every five years, e.g., due to a change in brand identity. This is where the 60 in the formula comes from. We’re well aware that a brand redesign is, of course, no reason to throw away everything and start from scratch again and that a design system might even make a rebrand much easier. However, please bear in mind that we want to make very conservative assumptions here and that if a business decides to shake up things, it would still be necessary to adjust a lot of things in a design system that go beyond pure day-to-day maintenance.
- The estimate of our designers and engineers was that if one initially invests 20% of their time into building the design system, it will take them 12 months to get it up and running. If they invest less or more, the ramp-up phase will become longer or shorter in a linear manner because a given design system will always need the same amount of effort put into it. Please note that this assumption varies with the amount of person-power a company could put into a design system. Obviously, if there are 200 designers and 200 developers who could all spend 20% of their time on a design system, things might move much faster than 12 months, and the 240 and 120 in the formula could be tweaked accordingly. We consider our assumption reasonable for an ‘average’ set-up with ~10 designers and ~30 developers (plus/minus).
- However, a design system takes at least 6 months to set up. Anything less would be unrealistic in a real-world setting (due to coordination and alignment efforts), and we anticipated that probably no business would agree to invest more than 40% of designers’ or developers’ time in setting up a design system. That’s why we have included the max and min functions in the formula, and that’s where the 6 and 54 (60 months minus 6 months) come from.
- For the first half of the ramp-up phase, we have no productivity gains yet.
- For the second half of the ramp-up phase, we have 50% productivity gains. That’s why we have 3 instead of 6 in the gain part of the formula.
- After the ramp-up phase, we have full productivity gains.
With these assumptions in place, we can now have a look at what the parameters X, Y, and Z mean.
Parameters
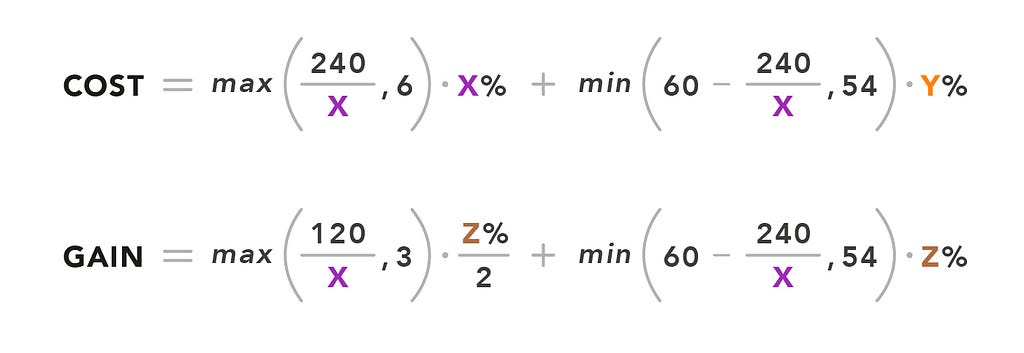
X denotes the percentage of time invested in building the design system. If X=20, the formula gives us 240⁄20=12 months of ramp-up phase.
Note: For X<4.62, the formula “breaks down” since the ramp-up phase would be ≥5 years.
Y denotes the percentage of time invested in ongoing maintenance after the ramp-up phase. In our specific case, we assumed 0.5X, but essentially, Y could be anything.
Z denotes the amount of time saved by using the design system in percent. This is equal to productivity or efficiency gains.
X and Y are relatively straightforward to specify: you ‘just’ have to agree on how much time you want to / can spend taking care of the design system. However, Z is a different story. Since it’s the productivity gain yielded by the design system, it’s impossible to know the parameter precisely beforehand. So, how can we estimate Z in a meaningful way? Essentially, this is a predictive judgment, so we followed the advice by Kahneman et al. (2021) — considering the base rate of design system productivity gains by doing a literature review and averaging the numbers reported.
The existing studies about design system productivity gains we found most convincing were Klüver (2019), Loomer (2016), Ray (2018), Slack (2019), and Sparkbox (n.d.).
Klüver (2019), Ray (2018), and Slack (2019) report 50%, 31%, and 34% better efficiency for design teams, which means an average of Z=38.
Klüver (2019), Loomer (2016), and Sparkbox (n.d.) report 25%, 20%, and 47% better efficiency for development teams, which means an average of Z=31.
Hence, in our case, we calculated ROI separately for design and development teams with the two different values for Z, and then aggregated it afterwards. In the next section, we’ll guide you through how exactly that works.
Example
Acme, Inc. has a team of 5 designers and a team of 10 developers who want to kick off building a design system together. They want to prove that the gains yielded by a design system in the mid- to long-term far exceed the necessary investment. Therefore, they grab the design system ROI formula and get going.
They estimate that everyone would probably be able to invest 30% (X=30) of their time during the ramp-up phase and afterwards 10% (Y=10) for maintenance. They moreover rely on the above base rates for productivity gains (Z=38 for design, Z=31 for development). They start with the ROI for the design team over the next five years.
Design
On the cost side, 30% time investment means the ramp-up phase would be 240/30 = 8 months long. That is, 8*30% = 2.4 months would be effectively spent on building the design system. Afterwards, 60-8 = 52 months remain for the 5-year period, and of those, 52*10% = 5.2 months would be effectively spent on maintenance. Overall, there would be 7.6 months (out of five years) of work put into the design system.

On the gain side, a ramp-up phase of 8 months would mean four months of half the productivity gains. That is 4*(38%/2) = 0.76 months. Afterwards, for the remaining 52 months, we would see full productivity gains, i.e., 52*38% = 19.76 months. Overall, the design system would therefore save the design team 20.52 months of needless work.

Together with the 7.6 months of work spent on building and maintaining the design system, this yields an ROI of (20.52-7.6)/7.6 = 170%. In other words, you get $2.70 back for every dollar invested in the design system.
If one designer costs $5,000 a month, that means the design system would cost Acme, Inc. 7.6*$5,000*5 = $190,000 while it would save them 20.52*$5,000*5 = $513,000 when looking at the design team alone.
Development
Doing the same thing for development is relatively straightforward based on the above. Since the designers and developers at Acme, Inc. agreed on everyone investing 30% for ramp-up and 10% for maintenance, the cost side stays exactly the same. Like the designers, the developers will be busy with the design system for effectively 7.6 months over five years.
On the gain side, however, we have to exchange the value for Z, from 38 to 31. Luckily, that’s the only thing, and the rest remains as above.

So, in the case of development, we’d invest 7.6 months and save 16.74 months of unnecessary work. This gives us an ROI of (16.74-7.6)/7.6 = 120%.
If one developer costs $6,000 a month, that means the design system would cost Acme, Inc. 7.6*$6,000*10 = $456,000 while it would save them a whooping 16.74*$6,000*10 = $1,004,400 when looking at the development team alone.
Bringing It All Together
Combining the calculations for design and development, therefore, yields the following:
Design:
- costs = $190,000
- gains = $513,000
- ROI = 170%
Development:
- costs = $456,000
- gains = $1,004,400
- ROI = 120%
Total:
- costs = $646,000
- gains = $1,517,400 (net gains = $871,400)
- ROI = (1,517,400–646,000) / 646,000 = 135%
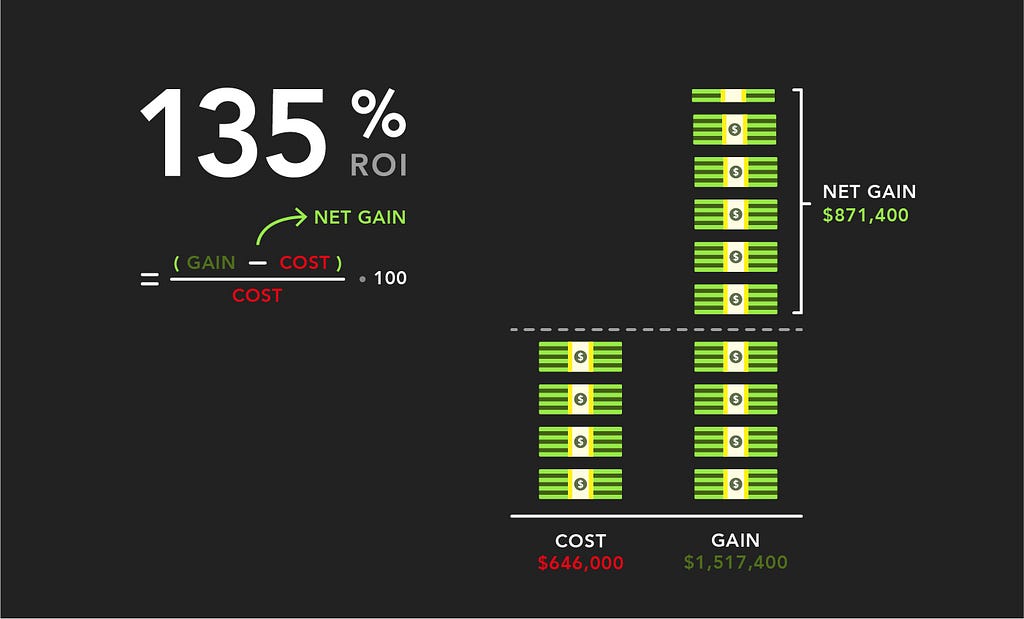
To top things off and make them look more like an approximation, you can round the final numbers and indicate the error. We’ve played around with some variance in the parameters (please feel free to do so on your own) and for the final result, ±25% seems to be reasonable. For instance, “we estimate 135% ROI and $900,000 (±225,000) net gains from the design system over five years.”
Conclusion
Based on Ben Callahan’s ‘Design System Efficiency Curve’ and our own experiences with pitching design systems to management, we have devised a general formula with only three parameters for quickly and easily calculating the ROI of a design system. We hope this formula will prove useful to our many colleagues that are just as excited about design systems as we are and want to get started working on this. As a little additional helper, you can download our design system ROI calculator in Excel.
We know all of this is just an approximation based on a lot of assumptions. Additionally, we have only considered designers and developers in a federated model here, and not dived deeper into topics like onboarding benefits, scale benefits, consistency and trust benefits, and better accessibility and usability, which all provide value on top of plainly being more productive (Callahan, 2021).
Also, we have not considered productivity gains for product, QA, and user research teams and so on (who as well benefit from a design system) in our formula. One reason for this is simplicity — we wanted to provide a formula that is feasible and easily understandable. Another is that efficiency gains in design and development teams are at the core of a design system, and benchmarks are widely available for determining the parameter Z. (All this, however, also means that the true ROI of a design system is probably much higher than what our formula yields, which makes the case even stronger rather than weaker.)
Despite all these limitations in our approach, the value of a design system is undeniable. We’re confident that our formula can reliably prove this and help build a compelling case, at the very least, for cases similar to ours. Otherwise, the underlying assumptions can be easily fine-tuned. And if in doubt, it’s always possible to implement a design system MVP and prove its value through a controlled experiment. We just hope we can help you get that MVP approved.
☕ I love coffee, and if you enjoy what I write, you can spend me one if you like, or subscribe to my newsletter. 🗞️
Acknowledgments
We want to thank Ben Callahan and Martin Schmitz for taking the time to read earlier drafts of this article and providing invaluable feedback. And, of course, a big shout-out to all members of the BestSecret Design System Task Force.
References
Boehm, Barry, and Victor R. Basili. “Top 10 list [software development].” Computer 34, no. 1 (2001): 135–137.
Callahan, Ben. “The Never-Ending Job of Selling Design Systems.” A List Apart, February 9, 2021. Accessed July 28, 2022.
Curtis, Nathan. “Team Models for Scaling a Design System.” EightShapes, September 17, 2015. Accessed August 4, 2022.
Fanguy, Will. “A Comprehensive Guide to Design Systems.” Inside Design Blog, June 24, 2019. Accessed July 28, 2022.
Fessenden, Therese. “Design Systems 101.” Nielsen Norman Group, April 11, 2021. Accessed July 28, 2022.
Kahneman, Daniel, Olivier Sibony, and C. R. Sunstein. Noise. HarperCollins UK, 2021. (this is an affiliate link)
Klüver, Anja. “Design as an Agent for Change: The Business Case for Design Systems,” YouTube video, 29:45, November 29, 2019.
Loomer, Drew. “How Your Company Benefits by Building a Design System.” Projekt202, October 13, 2016. Accessed July 28, 2022.
Manwaring, Brendon, and Josh Mateo. “The Paradox of Design Systems.” Spotify Design, December 2018. Accessed August 4, 2022.
Ray, Bryn. “How Much Is a Design System Worth?” UX Collective, July 19, 2018. Accessed July 28, 2022.
Slack, Clancy. “Measuring the Value of Design Systems.” Figma, December 19, 2019. Accessed July 28, 2022.
Sparkbox. “The Value of Design Systems Study: Developer Efficiency and Design Consistency.” Sparkbox.com, n.d. Accessed July 28, 2022.
Speicher, Maximilian. “What’s a Design System, Design Language, and Design Language System? And What’s the Difference?” The Startup, May 31, 2020. Accessed July 28, 2022.
Wong, Euphemia. “Principle of Consistency and Standards in User Interface Design.” The Interaction Design Foundation, October 2019. Accessed July 28, 2022.
Copyright © 2022 by Maximilian Speicher & Guido Baena Wehrmann ● Originally published by Smashing Magazine
One formula to rule them all: the ROI of a Design System was originally published in UX Collective on Medium, where people are continuing the conversation by highlighting and responding to this story.
from UX Collective – Medium https://uxdesign.cc/one-formula-to-rule-them-all-the-roi-of-a-design-system-d3722ccefa14?source=rss—-138adf9c44c—4
